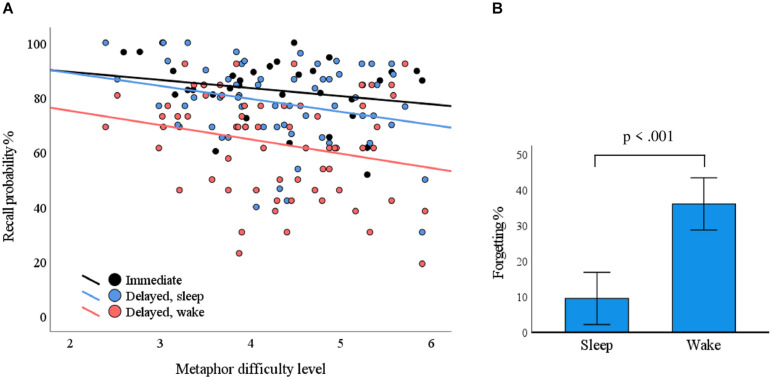
FIGURE 3.
The impact of metaphor difficulty and delay conditions on recall performance. (A) Each dot represents a metaphor. The probability for correct responses depended on the metaphor difficulty level in the delayed condition (p = 0.023; blue line, sleep; red line, wake). (B) The delay over sleep associated with less forgetting as compared with the wake condition (p < 0.001).

