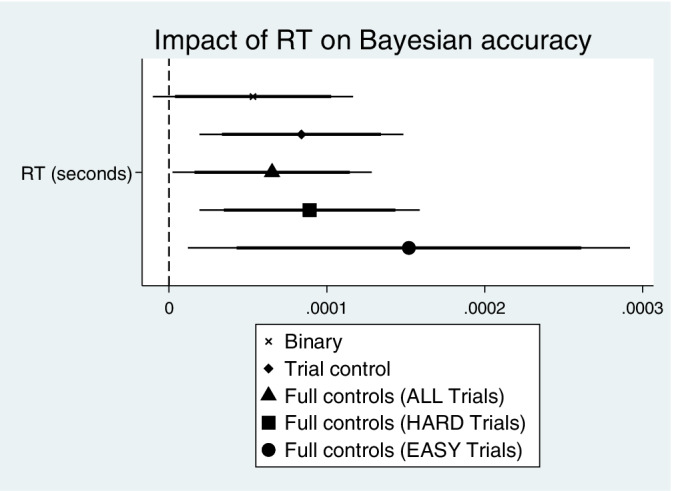
FIGURE 3.

Response time impact on accuracy. Coefficient estimates shown are of the Response Time binary indicator variable in the trial‐level models of Accuracy. Point estimates shown with 95% (thin line) and 90% (thick line) confidence intervals for models with varied specifications of control variables and sample of trial difficulty. See model 5 in Table 5 and models 3 and 6 in Table 6 for the “Full controls” estimation results (full estimation results for the “Binary” and “Trial controls” models available on request)
