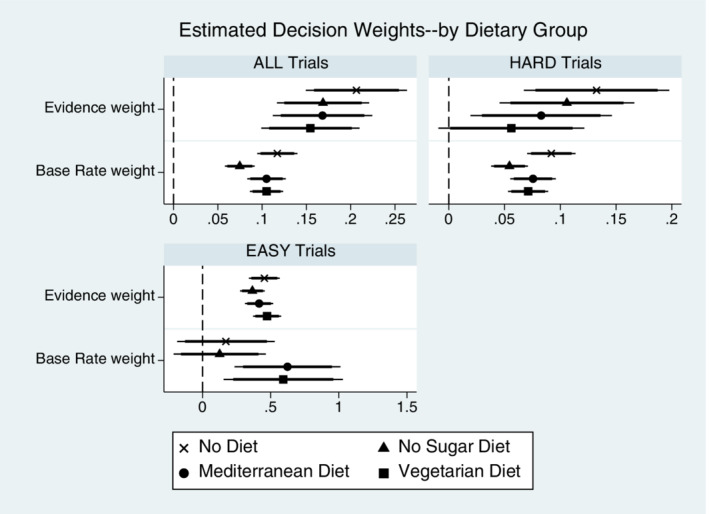
FIGURE 5.

Evidence and Base Rate weights effects (by Dietary Group). X‐axis are scaled differently in each panel. See Table 8 for marginal effects of the coefficient estimates. Plots above show coefficient estimates (not marginal effects) on the information variables for simple specifications (no controls) in Table 8. Point estimates shown with 95% (thin line) and 90% (thick line) confidence. Results are qualitatively similar if estimating the models with the full set of control variables, as seen in Table 8
