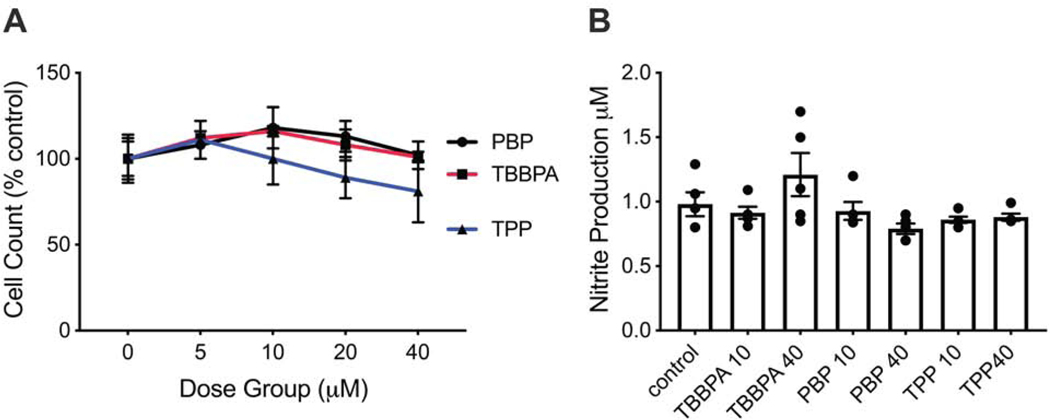
Figure 1.
A. Cell viability of BV-2 cells following 18 hr post-exposure to PBP, TBBPA, or TPP at various concentrations. Data represents total cell count (mean +/− SEM) as % of controls (n=4). B. Nitrite accumulation in BV-2 cells following 18 hr exposure to FRs at 10 μM or 40 μM for 18 hr as determined by Greiss assay. Data represents individual values and mean +/− SEM (n=5).

