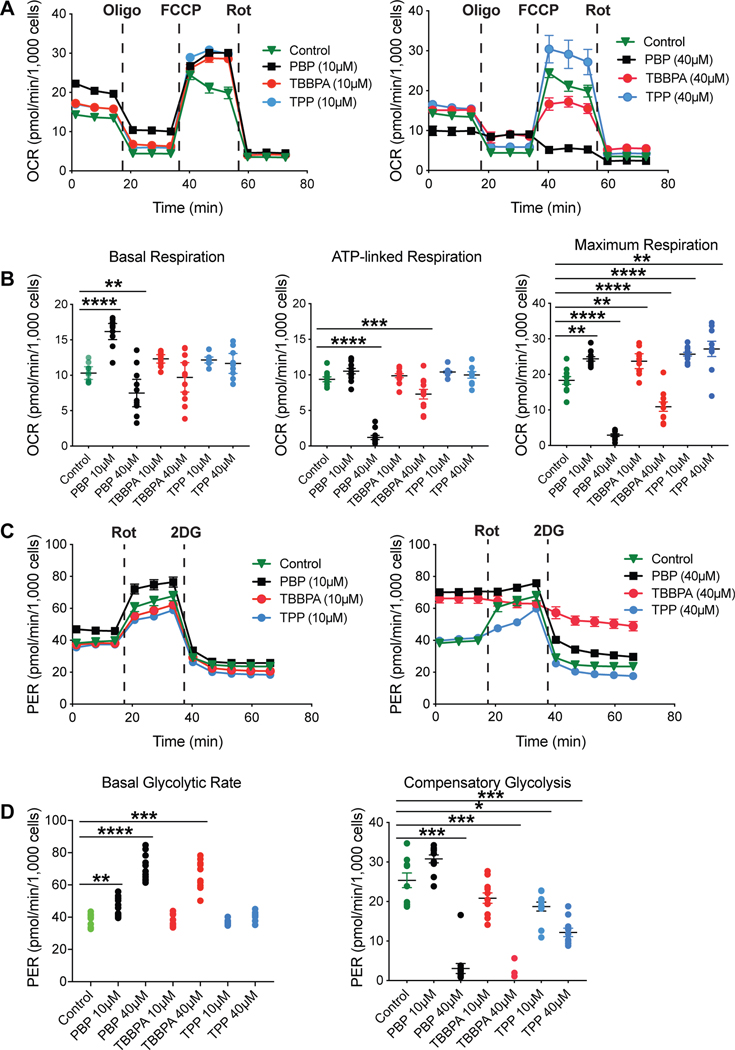
Figure 2.
A. Representative mitochondrial bioenergetics profile of BV-2 cells exposed to vehicle or PBP, TBBPA, or TPP at 10 (left image) or 40 μM (right image) for 18 hr. After signal stabilization (three measures) cells were sequentially exposed to the mitochondrial stressors: oligomycin (Oligo), FCCP, and rotenone (Rot). B. Basal respiration was significantly increased with 10μM PBP and decreased at 40 μM. ATP-linked respiration was significantly decreased at 40 μM PBP and TBBPA. Maximum respiration was significantly altered for all FRs at all exposure levels. C. Representative glycolytic profile of BV-2 cells exposed to vehicle or PBP, TBBPA, or TPP at 10 or 40 μM. Cells were sequentially exposed to Rot and 2-deoxyglucose (2DG). D. Basal glycolytic rate was significantly increased for PBP at both exposure levels and for TBBPA at 40μM. With the exception of no change at PBP 10 μM, compensatory glycolysis was significantly decreased for all FRs at both exposure levels. A,C data represents mean response (n=9); B,D data represents individual values and median (n=9). * p<0.05; **p<0.01; ***p<0.001; ****p<0.0001.

