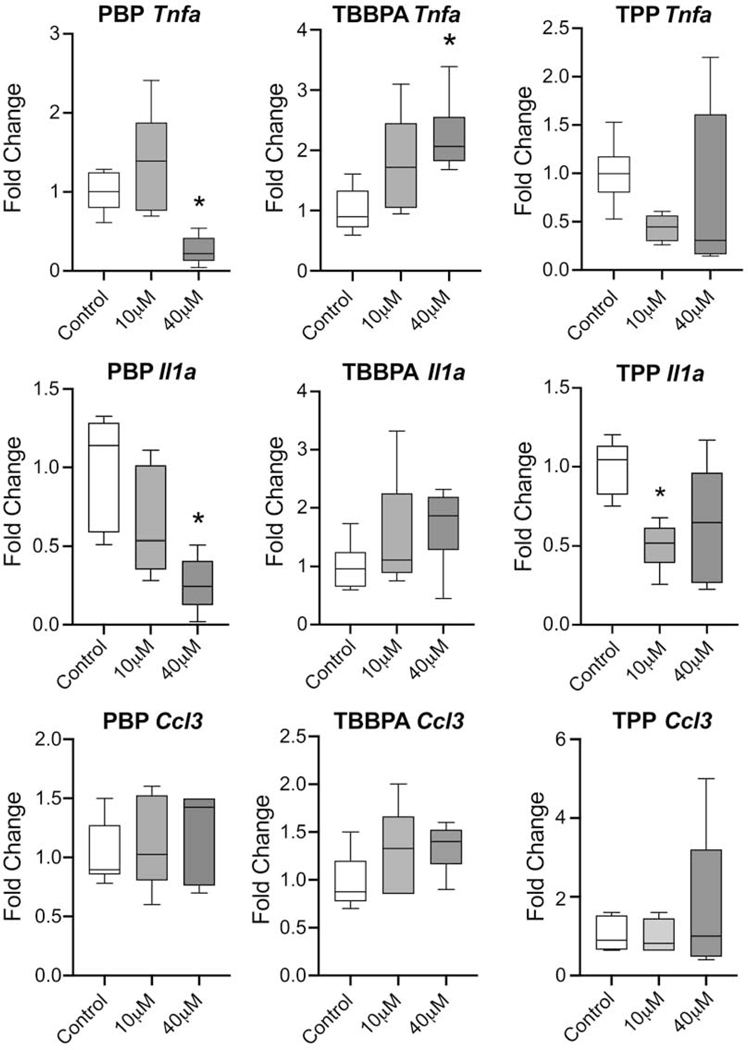
Figure 4.
A. Tnfa, Il1a, and Ccl3 mRNA levels in BV-2 cells following 18 hr exposure to PBP, TBBPA, or TPP at 10 or 40 μM determined by qRT-PCR using TaqMan®. Relative gene expression amounts normalized to GAPDH and presented as fold change from control. B. Data was analyzed by a one-way ANOVA for each FR followed by Dunnett’s tests for independent group mean comparisons. Data represents (n=6). *p<0.05

