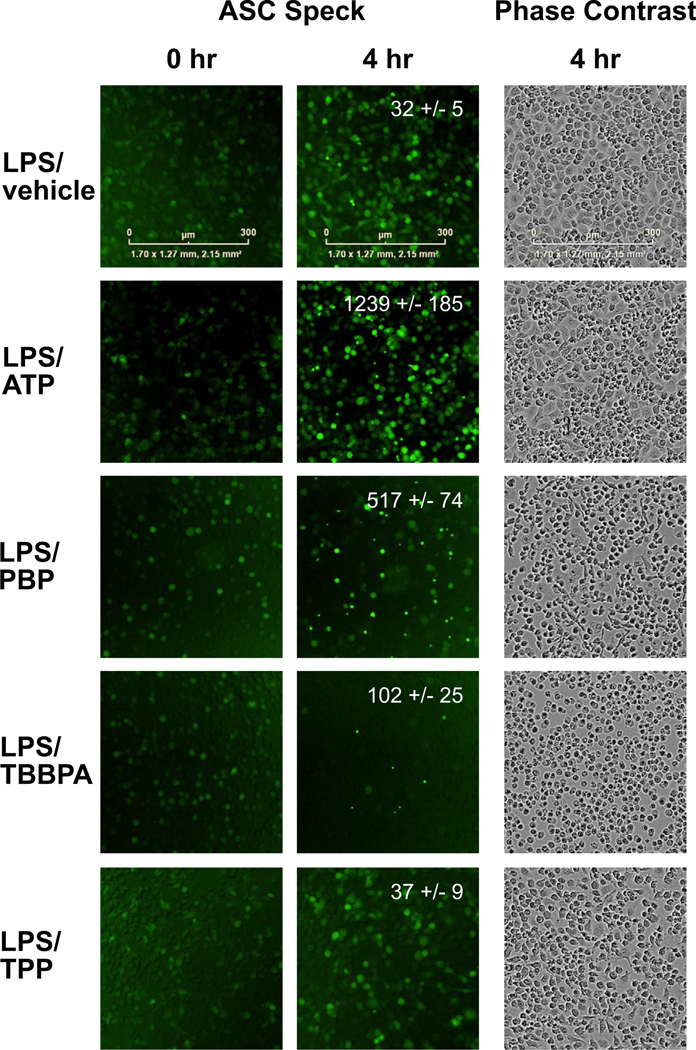
Figure 8.
Representative images of BV-2 ASC Speck cells and inflammasome activation over 4 hr. Images were captured an IncuCyte S3 live-cell analysis system and IncuCyte ZOOM 2015A software. Regions of interest (ROI) were identified within each well, standardized by total number of cells, threshold set for Speck size and intensity, and the number of ASC SPECKS (fluorescent aggregates) within each ROI determined using Fiji ImageJ software. Data represents mean +/− SEM (n=6).

