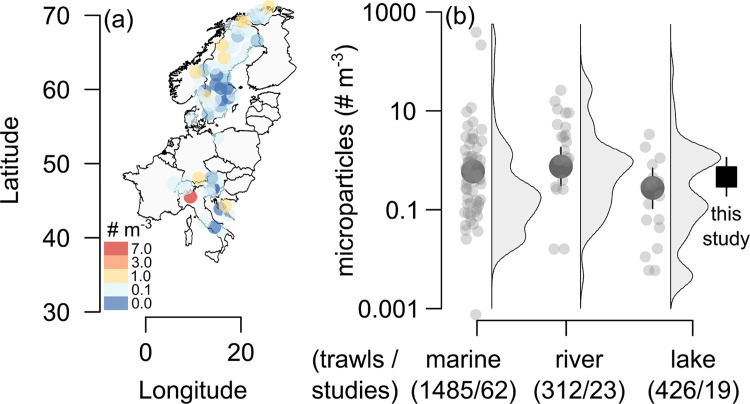
Fig 1. Lakes in Europe harbour more anthropogenic microparticles than elsewhere.
(a) Concentrations of microparticles (310 to 5,000 μm) across 67 lakes sampled in 2019. (b) Microparticle concentrations in surface waters of European lakes from (a) (square symbol) exceeded those estimated, on average, in published studies of lakes, but was similar to marine/estuarine and river environments. Filled circles are estimated means ± 95% CIs compiled from published studies for each environment with square denoting concentrations observed in this study. Numbers beneath habitat types are total number of trawls/unique studies, and values (67/1) from this study are included in lake counts. Studies generally counted particles up to 5,000 μm in size, but some did not specify an upper limit, and lower limits varied from 45 to 780 μm and were accounted for when estimating means in our statistical analysis (see Methods). Published studies were compiled by reviews in [6] (N = 55), [47] (N = 7), [48] (N = 8), [49] (N = 2), [50] (N = 1), and ourselves (N = 23). The data underlying (a) are given in S1 Data, with the base map obtained from Natural Earth (http://www.naturalearthdata.com). The individual points shown in (b) are derived by fitting the model given in S3 Data to raw data in S1 Data, with values of summary statistics given in S2 Table.

