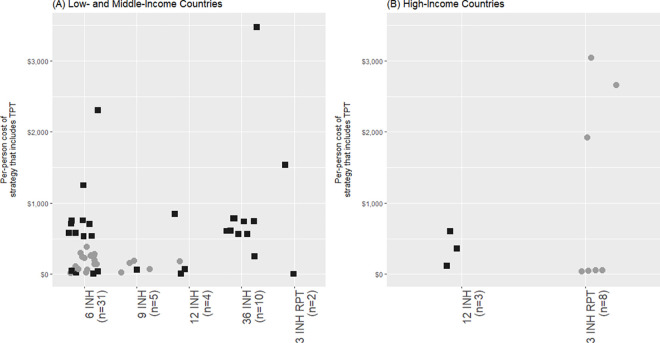
Fig 3. Per-person cost of TPT versus no TPT, by TPT regimen and country-level income.
ART, antiretroviral therapy; INH, isoniazid; RIF, rifampin; RPT, rifapentine; TB, tuberculosis; TPT, tuberculosis preventive therapy. Each data point represents a study arm or “strategy.” Outliers are analyzed in further detail in the Outliers section of S1 Text. Costs displayed in this figure include program costs related to TPT delivery (drug costs, personnel costs, and material costs) as well as costs related to TB care for those who develop active TB (drug costs, hospitalization costs, and personnel costs). Importantly, these come from studies that compared the use of TPT to no TPT and do not include studies that comparing directed TPT to TPT for all. The use of ART is distinguished in this figure; filled black squares (■) represent strategies that included the cost of ART, while filled gray circles (●) represent strategies that did not include the cost of ART.

