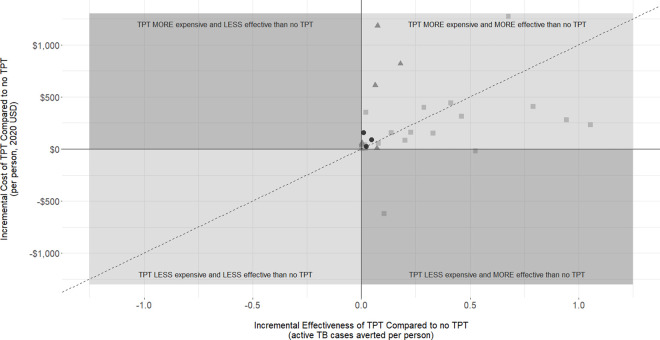
Fig 4. Incremental cost versus incremental effectiveness, comparing TPT to no TPT.
INH, isoniazid; TB, tuberculosis; TPT, tuberculosis preventive therapy; USD, United States dollar. Each data point represents an individual study arm. Data points in the top right quadrant represent instances where TPT was found to be more effective than no TPT in reducing active TB incidence; however, TPT was more expensive than no TPT. Data points in the bottom right quadrant represent instances where TPT was found to be more effective than no TPT in reducing active TB incidence, and TPT was less expensive than no TPT. The lack of data points in the top left and bottom left quadrants means that there was no instance where TPT was predicted to be less effective than no TPT in reducing active TB incidence. The different shapes of data points represent different TPT regimen categories; filled black circles (●) represent INH-based regimens longer than 12 months, filled gray squares (■) represent INH-based regimens between 6 and 12 months, and filled gray triangles (▲) represent rifamycin-based regimens. The dashed line represents an incremental cost-effectiveness value of $1,000 (where incremental cost active TB case averted = $1,000).

