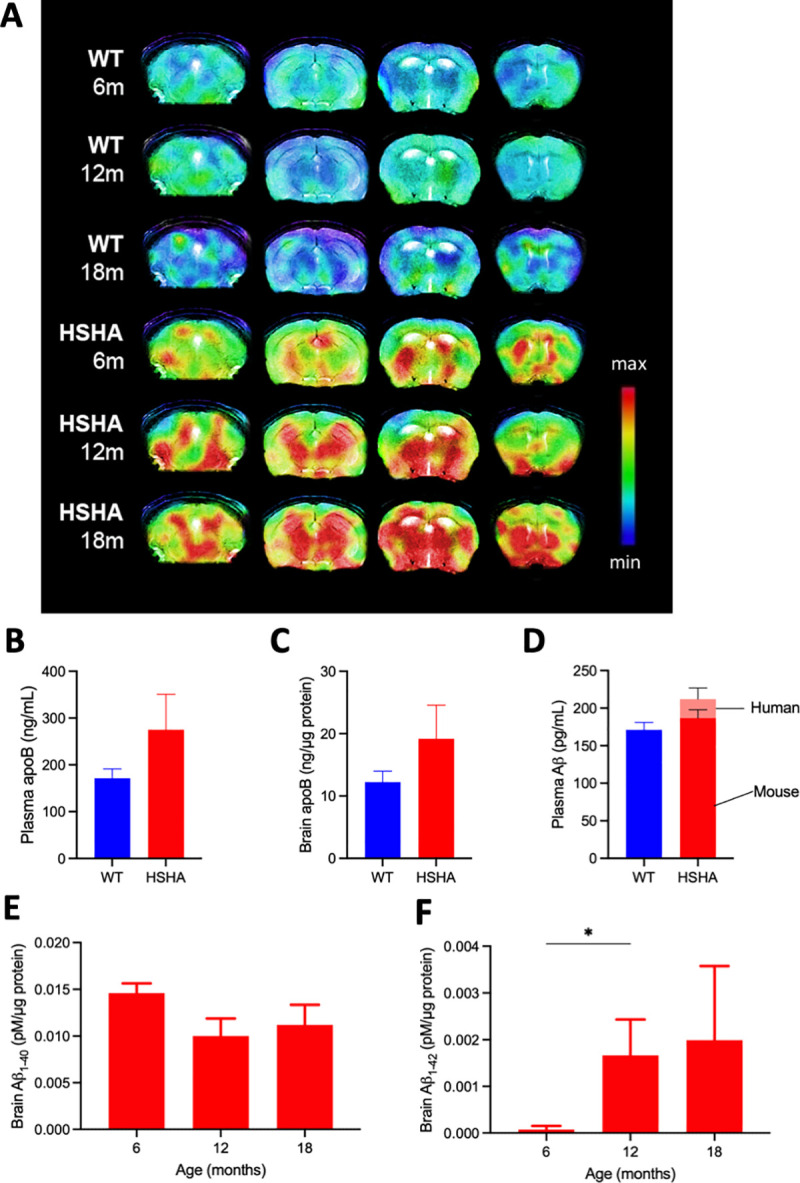
Fig 2. Plasma and brain concentrations of apo B and Aβ.

(A) In vivo PET detection of amyloid binding was used to confirm cerebral amyloid deposition in HSHA mice and their age-matched WT controls. Representative PET and MRI fusion images (coregistered with MRI templates using conventional Fast Spin Echo Sequence T2-weighted sequence) show scan data at 20 to 40 minutes’ post-intravenous administration of [11C] PiB. Each panel (from left to right) illustrates maximum binding potential for [11C] PiB represented by coronal images at −2, 0, 4, and 6 mm from the bregma; indicated by the vertical bar. Plasma (B) and brain (C) levels of apo B, a surrogate marker of TRLs in HSHA and WT control mice, were determined with ELISA. Data are expressed as mean ± SEM. Human and mouse isoforms of Aβ in plasma (D) and brain (E, F) were measured separately with ELISA kits using antibodies specific to each isoform. The data underlying Fig 2B–2F can be found in S1 Data. Aβ, amyloid beta; apo B, apolipoprotein B; HSHA, hepatocyte-specific human amyloid; MRI, magnetic resonance imaging; PET, positron emission tomography; PiB, Pittsburgh compound; TRL, triglyceride-rich lipoprotein; WT, wild-type.
