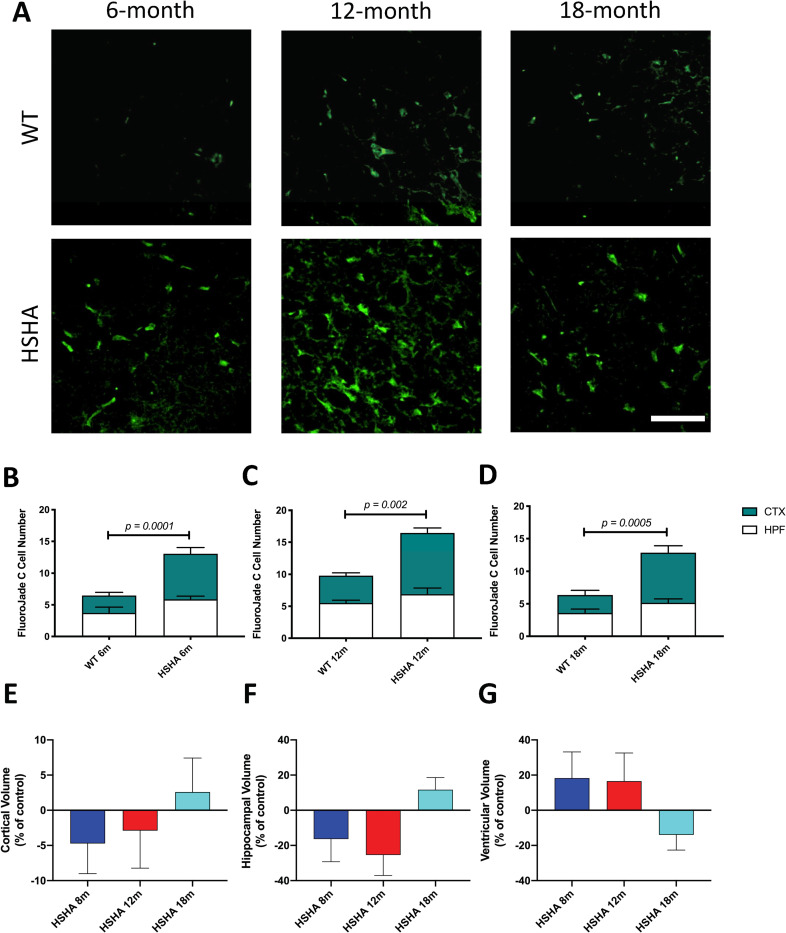
Fig 4. Neuronal degeneration and brain volumetric analyses in HSHA mice.
(A) Representative 3D confocal immunomicroscopy images of degenerated neurons in HSHA mice and their respective controls at 6, 12, and 18 months of age, indicated by FluoroJade C staining in green; scale bar depicts 50 μm (B–D) Quantitative analysis of neuronal degeneration in HSHA mice. The number of degenerative neurons, as indicated by FluoroJade C positive cells assessed by quantitative confocal immunomicroscopy, is shown in 6-month-old (B), 12-month-old (C), and 18-month-old (D) HSHA mice and their respective age-matched controls, in the CTX and HPF. Statistical significance was tested by an unpaired t test with Welch correction testing for nonequivalence of standard deviations. Data are presented as mean ± SEM (n = 4–10; p-values only indicated for significance). (E–G) Comparison of regional brain volumes measured by in vivo 3D T2-weighted MRI in young and old HSHA mice. The percentage volume difference between (E) CTX, (F) HPF, and (G) combined lateral, third, fourth, and cerebral aqueduct VNT volumes versus the respective regional mean volume of HSHA mice and their WT controls at 8, 12, and 18 months, are indicated. Each image data set was reconstructed, processed, coregistered with the Allen Mouse Brain Atlas, and analysed per region of interest (n = 2–3). Treatment differences were assessed by one-way ANOVA by comparing the percentage volume difference for HPF, CTX, and VNT size versus the respective regional mean volumes at 8, 12, and 18 months of age. No significant differences were observed at p < 0.05. The data underlying this figure can be found in S1 Data. CTX, cortex; HPF, hippocampal formation; HSHA, hepatocyte-specific human amyloid; MRI, magnetic resonance imaging; VNT, ventricular; WT, wild-type.

