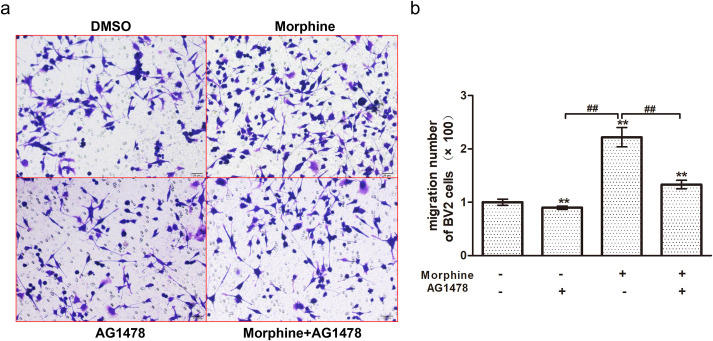
Fig 6. The effect of EGFR inhibition on migration of BV-2 cells induced by morphine.
(a) BV-2 cells were treated with morphine or AG1478 for 48 h, and the number of migrated cells was evaluated by the Transwell assay. Scale bar: 20 μm. (b) Migration of BV-2 cells in six randomly selected fields from each group was quantified. Data are expressed as the means ± SEMs. All data were analyzed using ANOVA. * p < 0.05 and ** p < 0.01 compared to DMSO groups. ## p < 0.01 morphine vs. morphine + AG1478.

