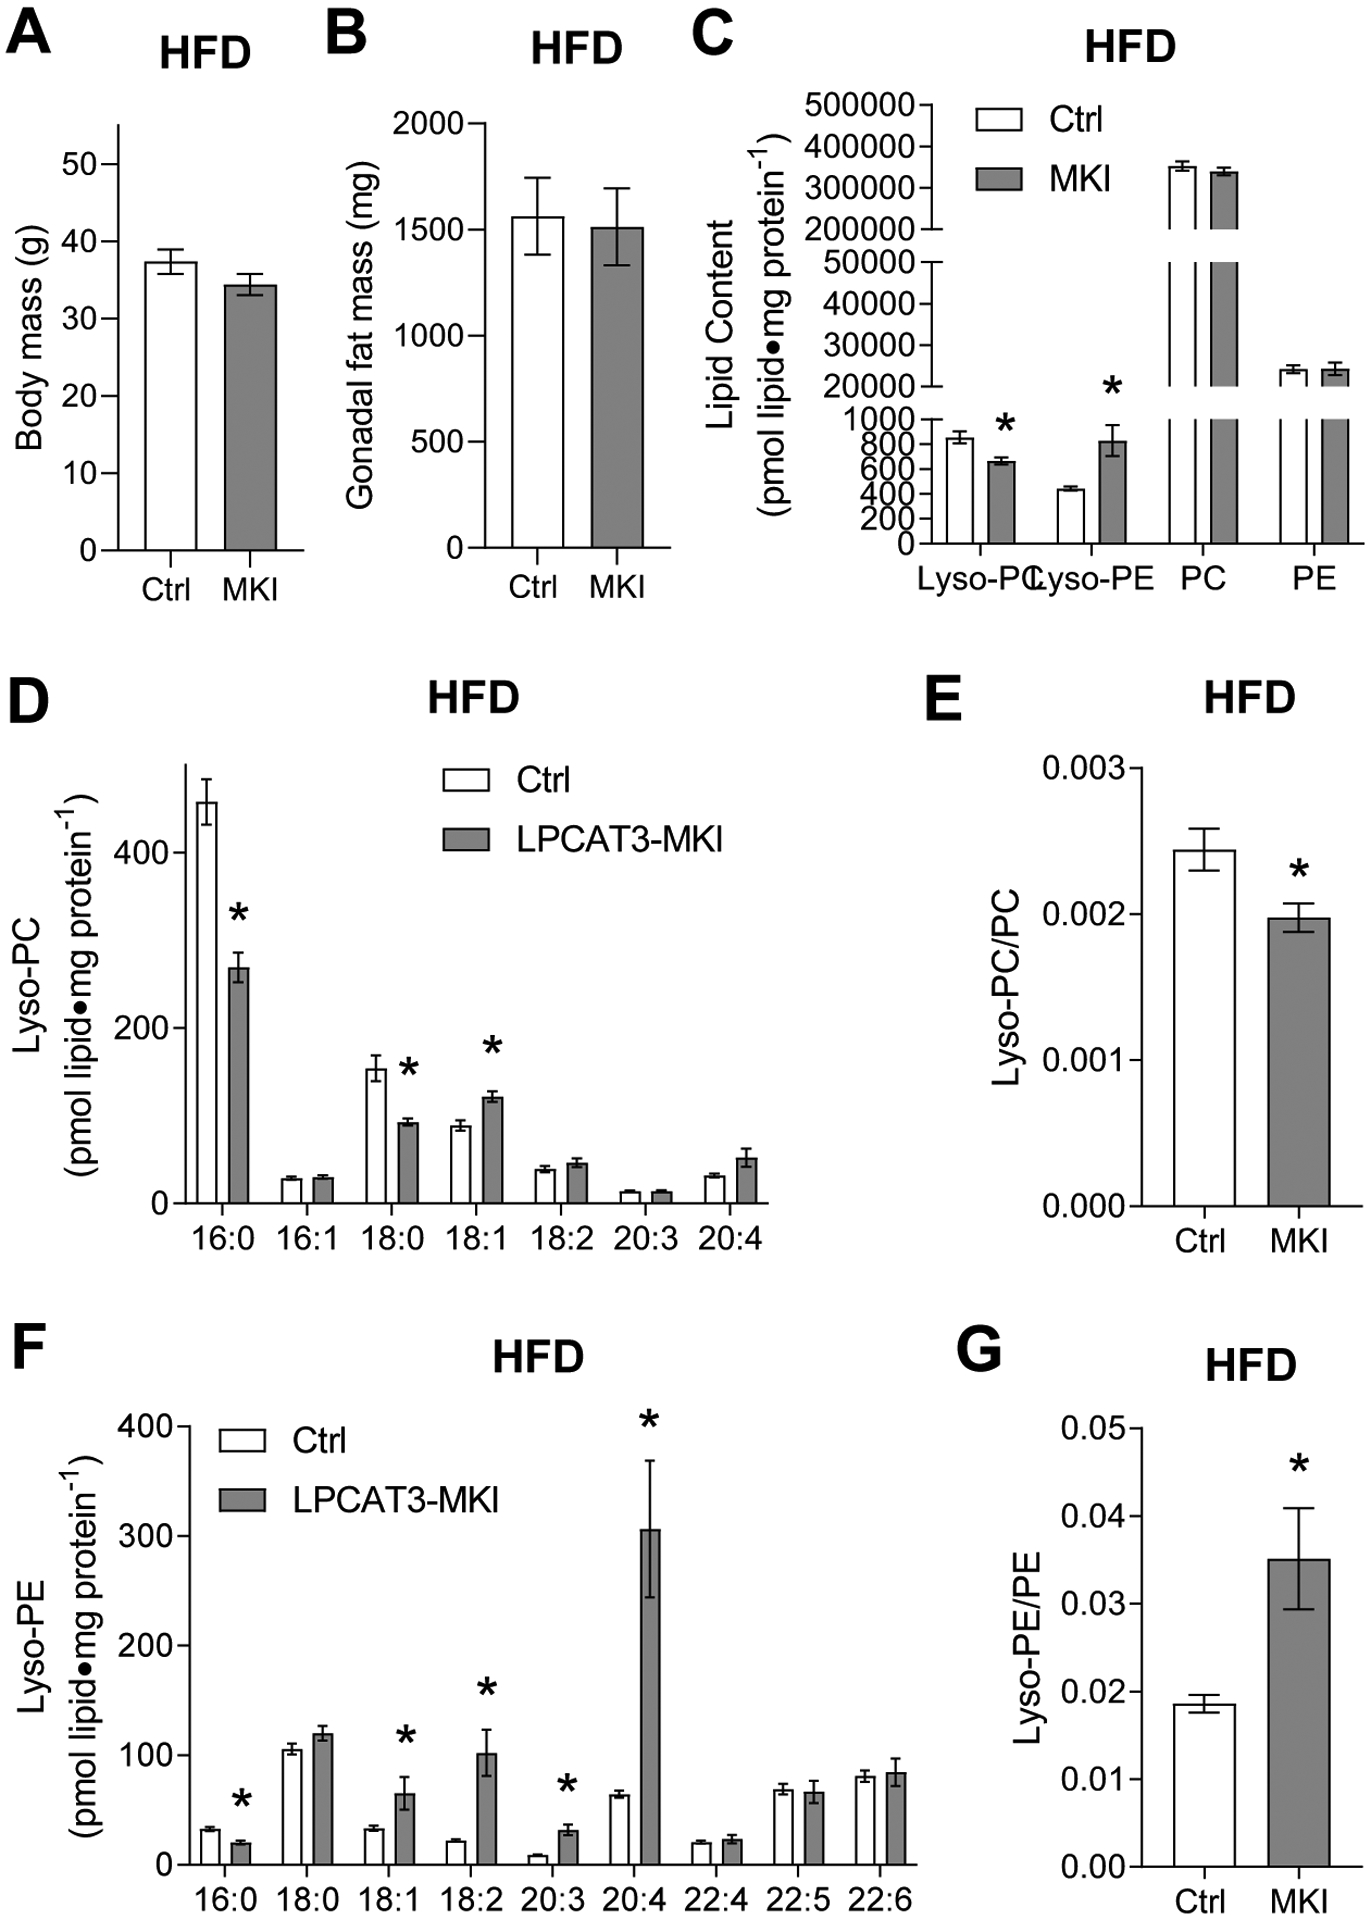
Figure 4: Low lyso-PC, but not lyso-PE, in muscles of LPCAT3-MKI compared to control mice (high-fat diet).

(A) Body mass. (B) Gonadal fat mass. (C) Total lipids by class, (D) lyso-PC species, (E) lyso-PC/PC ratio, (F) lyso-PE species, and (G) lyso-PE/PE ratio. All data are from mice that were fed high-fat diet. Ctrl: control, MKI: LPCAT3-MKI. n=11/group. Two-tailed t-tests or 2-way ANOVA with Sidak’s multiple comparisons tests were performed. All data are mean ± SEM. *P ≤ 0.05.
