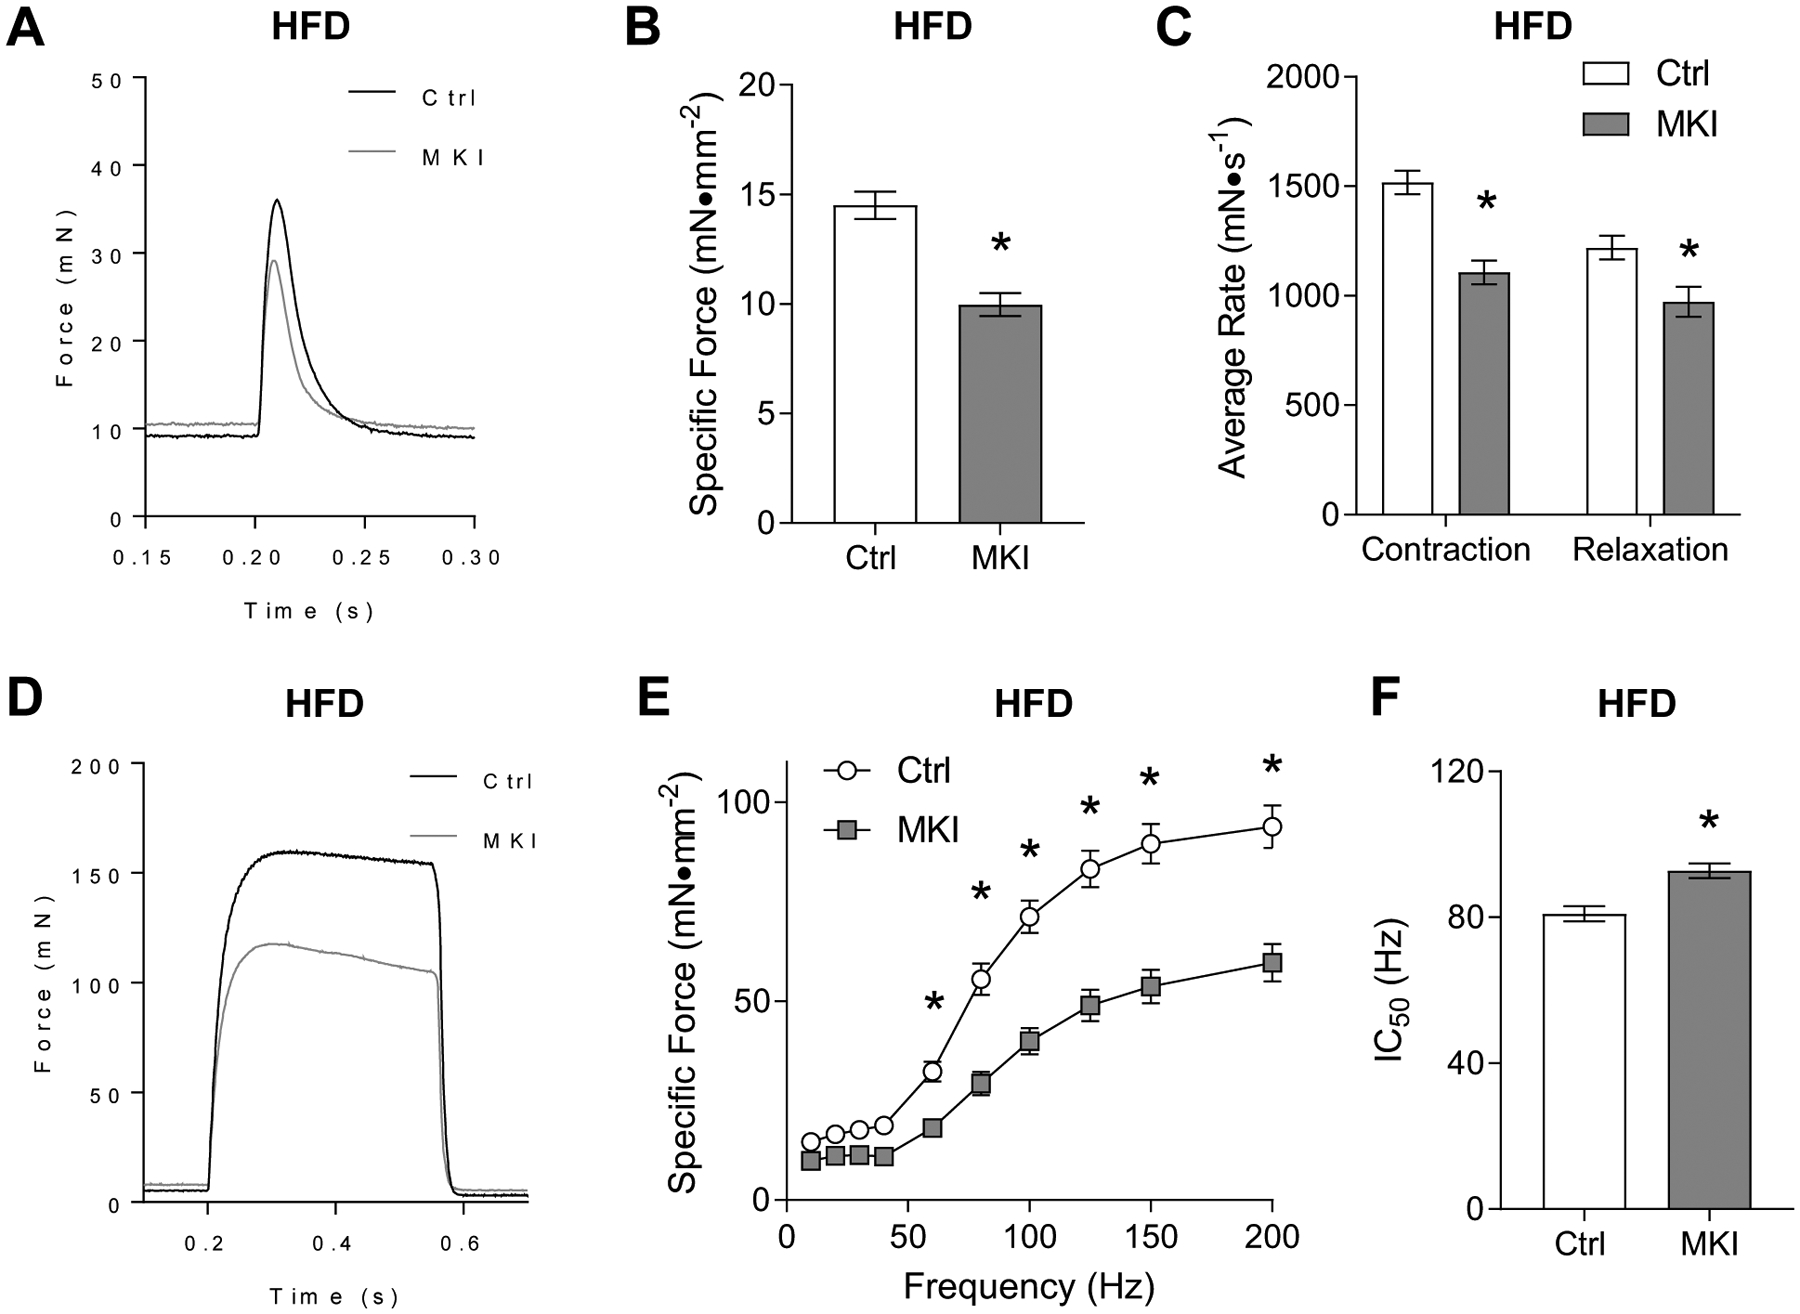
Figure 5: LPCAT3-MKI mice exhibit a more dramatic contractile defect after high-fat diet feeding.

EDL muscles of control (Ctrl) and LPCAT3-MKI (MKI) mice were dissected for the analysis of ex vivo force production after (A-C) a single-pulse stimulation to initiate a twitch contraction or (D-F) across a range of stimulation frequencies (10–200 Hz) to generate a force-frequency curve. (A) Force tracings of EDL muscles after a single pulse stimulation in Ctrl and LPCAT3 MKI mice. (B) Force normalized to muscle cross-sectional area (specific force). (C) The average rate of contraction and average rate of relaxation between Ctrl and LPCAT3-MKI EDL muscles. (D) Force tracings of EDL muscles after a 200 Hz stimulation between Ctrl and LPCAT3-MKI mice. (E) Specific force of EDL muscles across a range of stimulation frequencies in Ctrl and LPCAT3-MKI mice (main effect of genotype, P=0.0003). (F) The frequency needed to illicit 50% maximal contraction of EDL muscles from Ctrl and LPCAT3-MKI mice. All data are from mice that were fed high-fat diet. Ctrl: n=5, LPCAT3-MKI: n=9. Two-tailed t-tests or 2-way ANOVA with Sidak’s multiple comparisons tests were performed. All data are mean ± SEM. *P ≤ 0.05.
