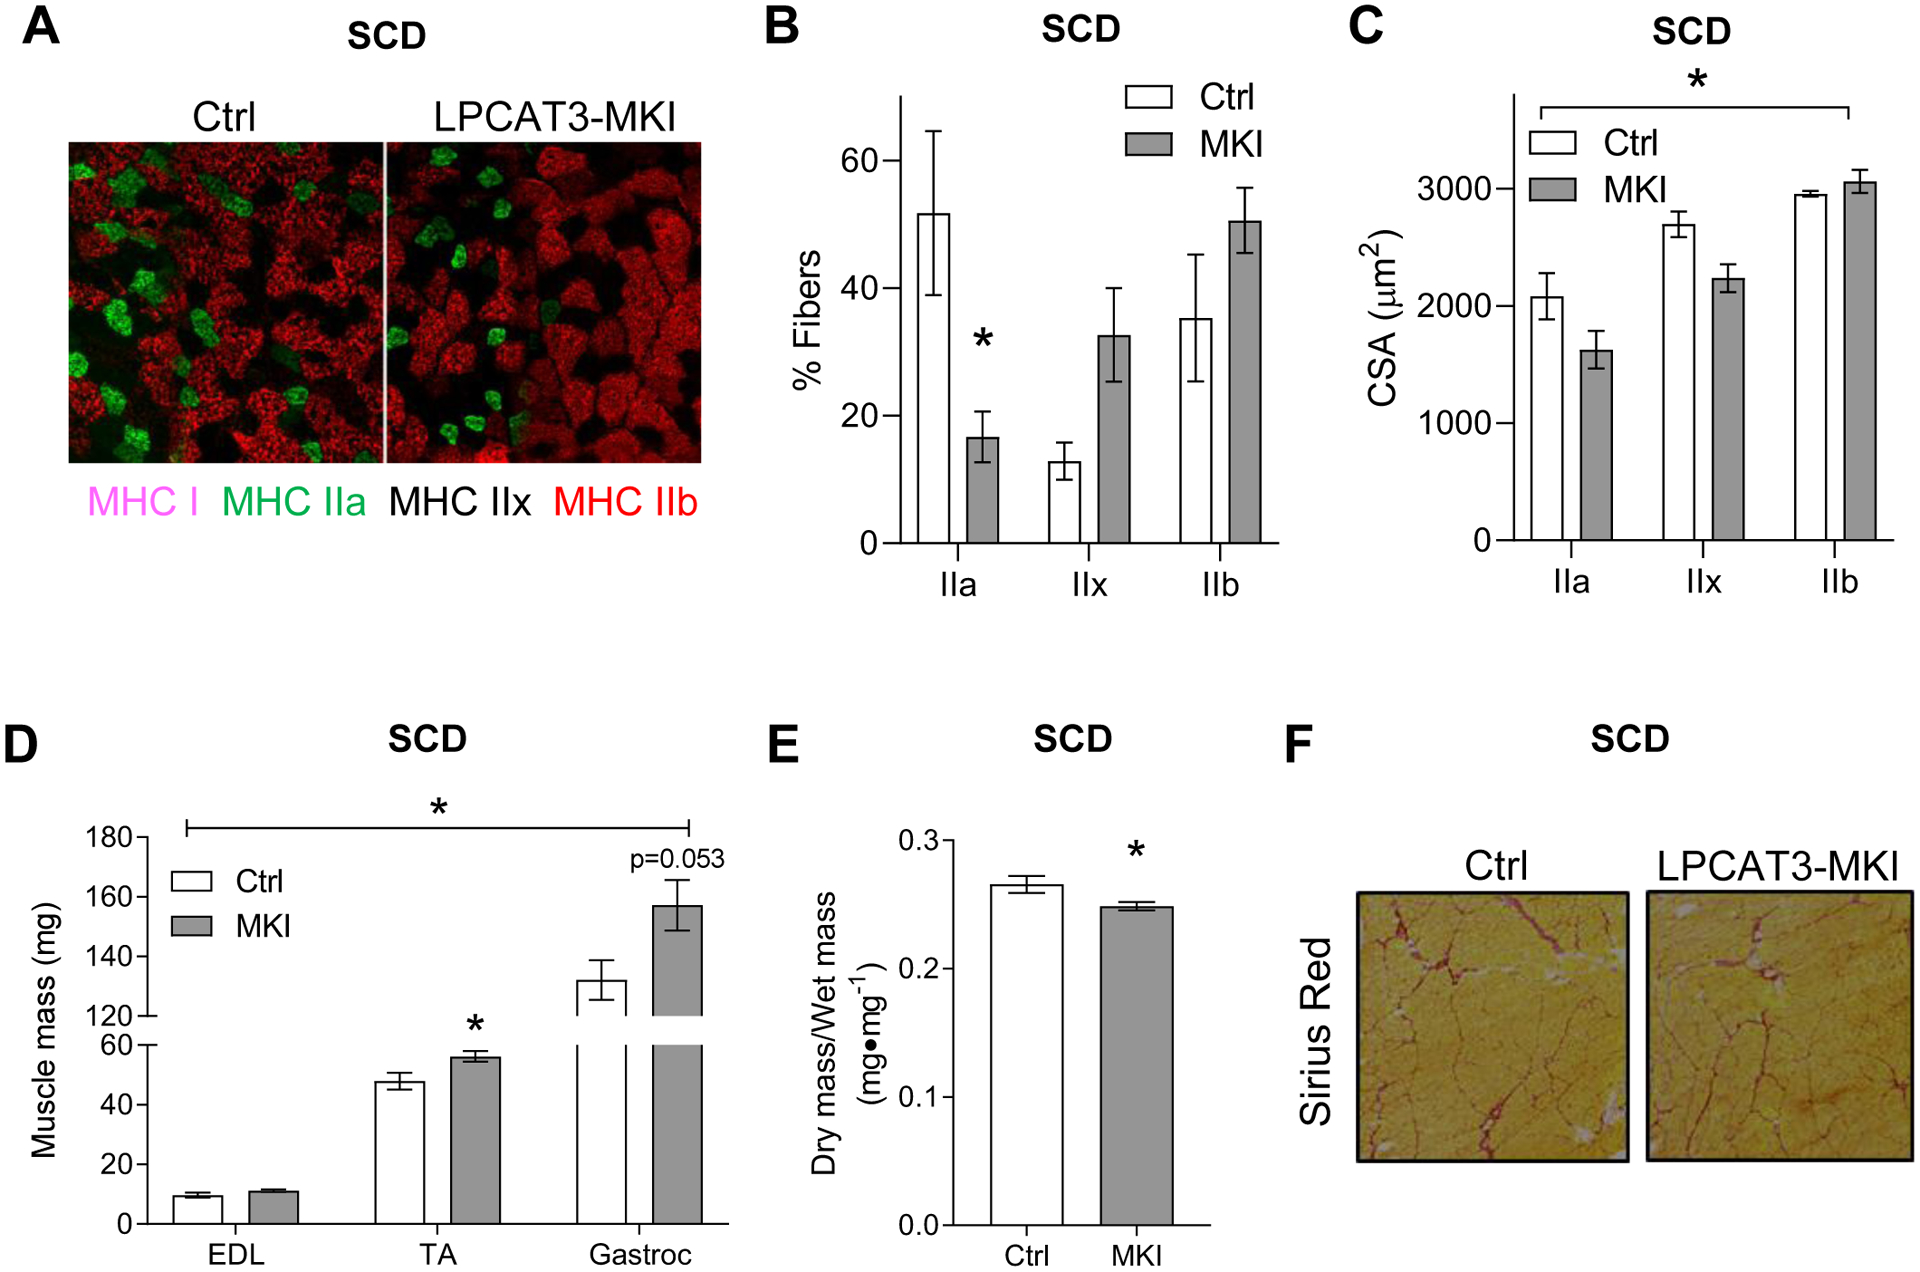
Figure 6: Skeletal muscle fiber-type and cross-sectional area in control and LPCAT3-MKI mice.

(A) Representative images of myosin-heavy chain immunofluorescence of TA muscle (MHC I: pink, MHC IIa: green, MHC IIb: red, and MHC IIx: negative). (B) Relative abundance of fibers expressing MHC IIa, IIx, and IIb. (C) Mean CSA stratified according to their MHC expression. n=3/group. (D) Mass of extensor digitorum longus (EDL), tibialis anterior (TA), and gastrocnemius (Gastroc) muscles (Ctrl n=4, LPCAT3-MKI n=4) (E) The ratio of dry/wet weight in gastrocnemius muscles of Ctrl and LPCAT3-MKI mice (Ctrl n=6, LPCAT3-MKI n=9). (F) Representative images of Picrosirius red staining of TA muscle. All data are from mice that were fed standard chow diet. Two-tailed t-tests or 2-way ANOVA with Sidak’s multiple comparisons tests were performed. All data are mean ± SEM. *P ≤ 0.05.
