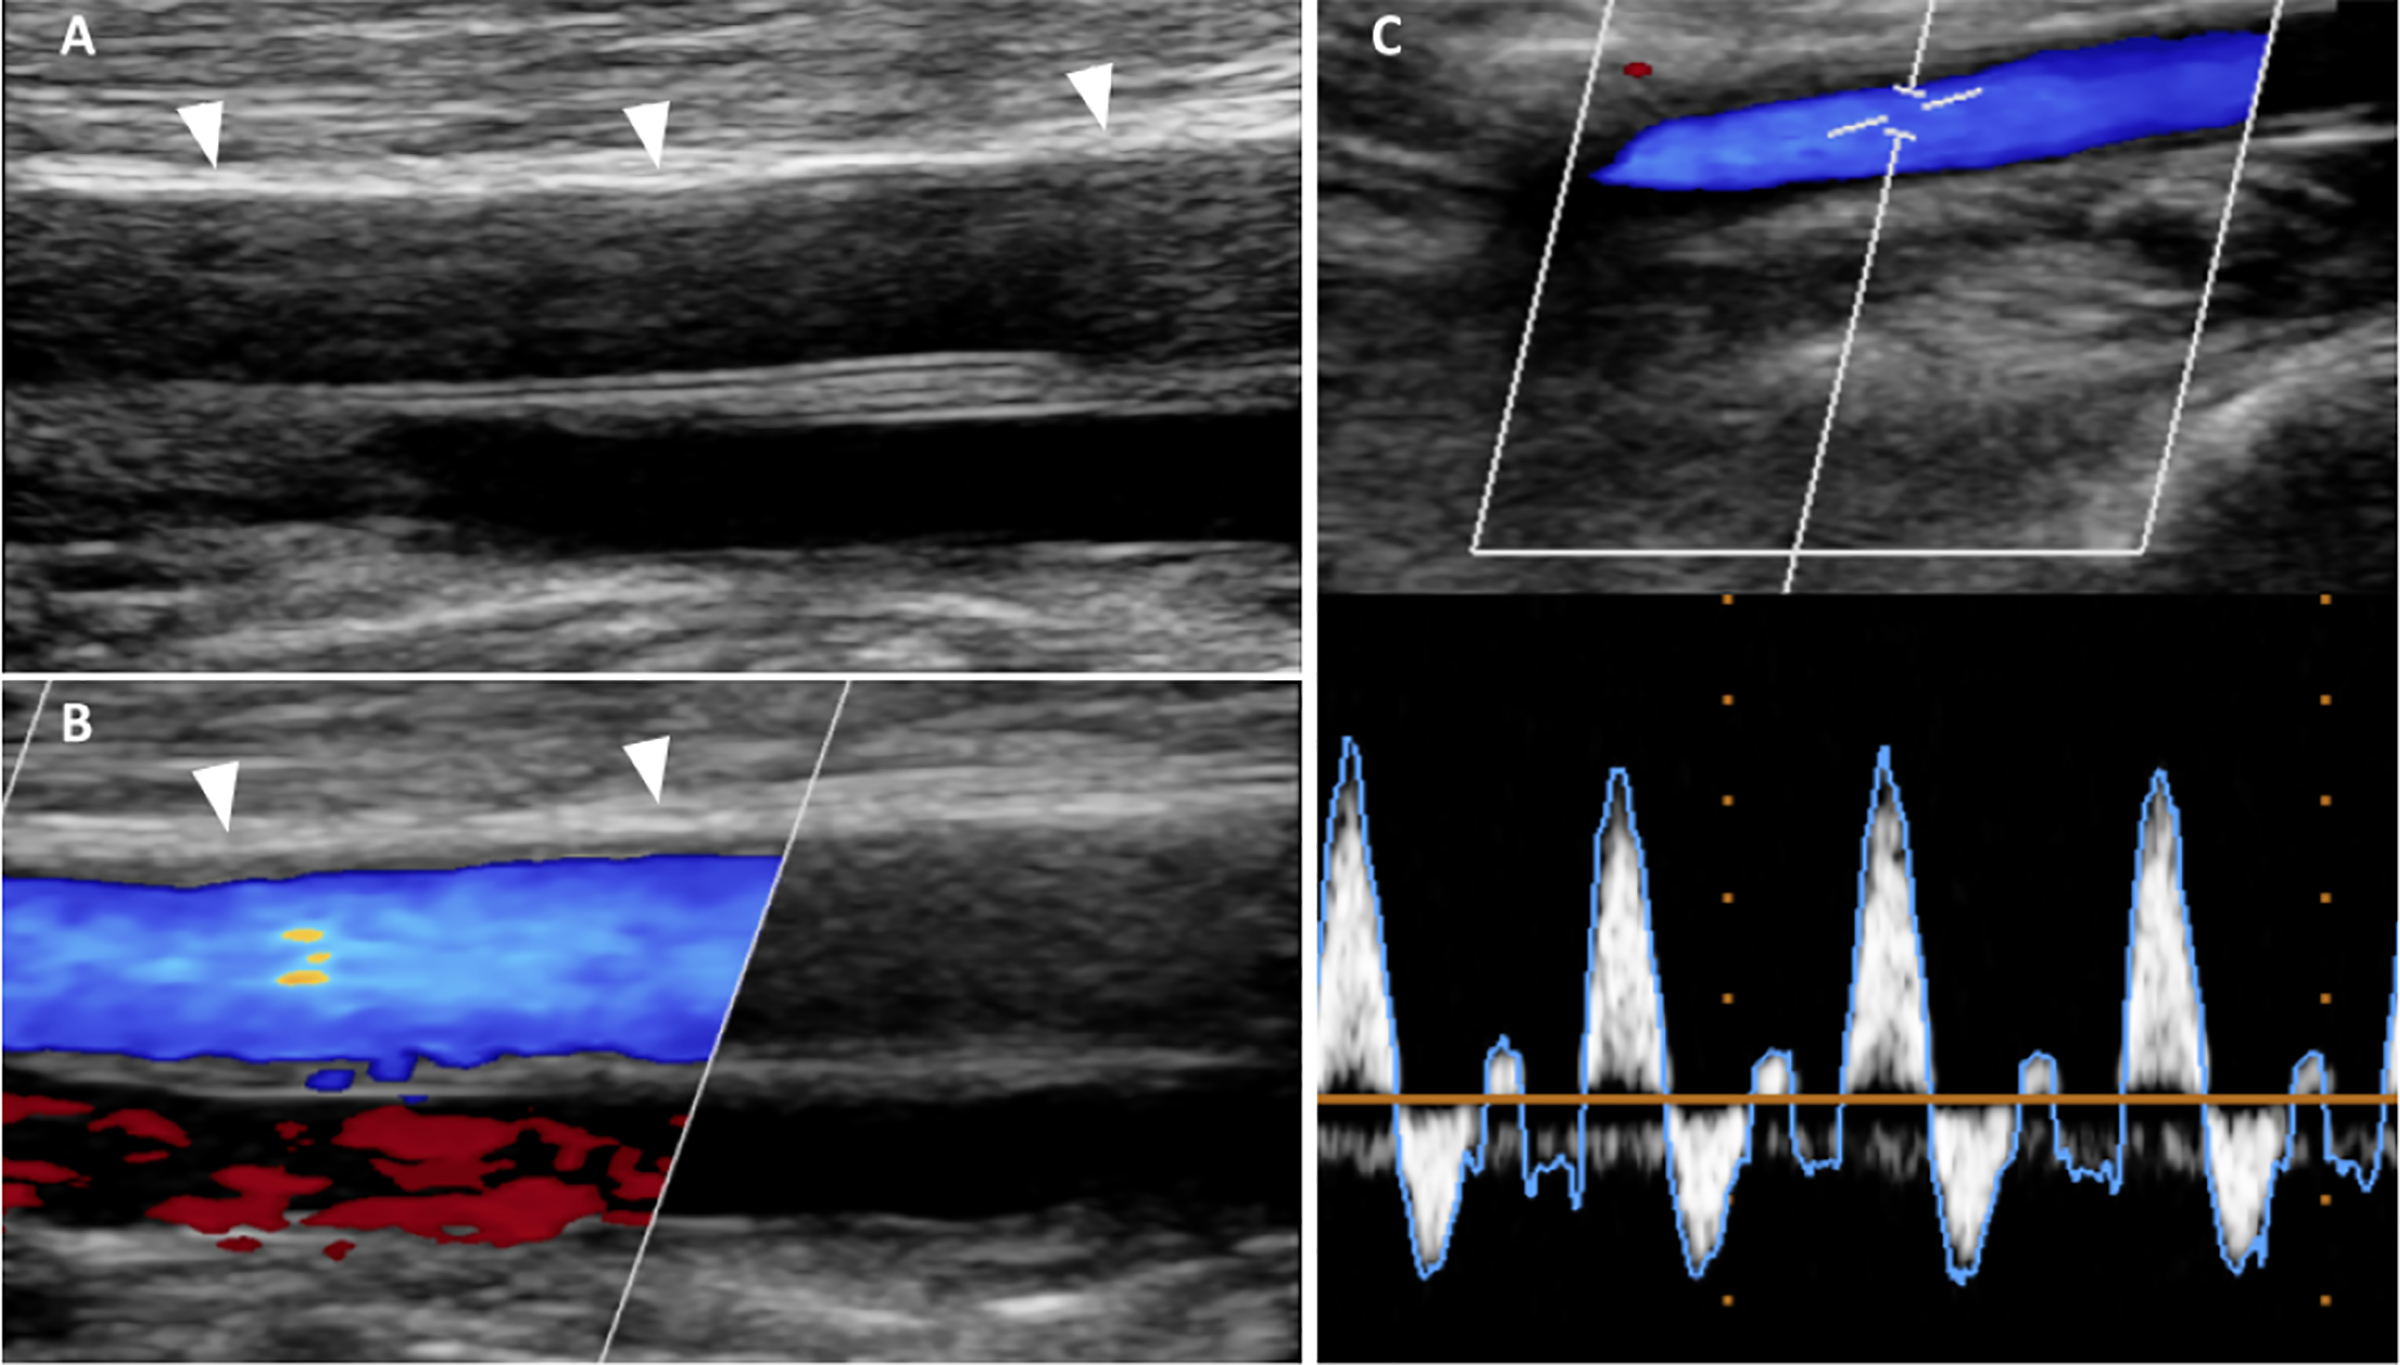
Figure 4. MAC in ultrasound.

Female with chronic kidney disease and MAC demonstrated by ultrasound. (A) B-mode ultrasound longitudinal image of the left superficial femoral artery (SFA) revealed on the near end arterial wall linear homogeneous echogenic band pathognomonic for MAC; note the smooth endothelial interface of the SFA; white arrowheads denote diffuse medial calcifications.(B) Color coded Doppler (CCD) image of A demonstrates normal arterial flow signal (blue color); red color corresponds to the accompanying vein; white arrowheads as in A. (C) CCD and pulse wave Doppler (PWD) images show a normal triphasic flow pattern indicating a normal artery.
