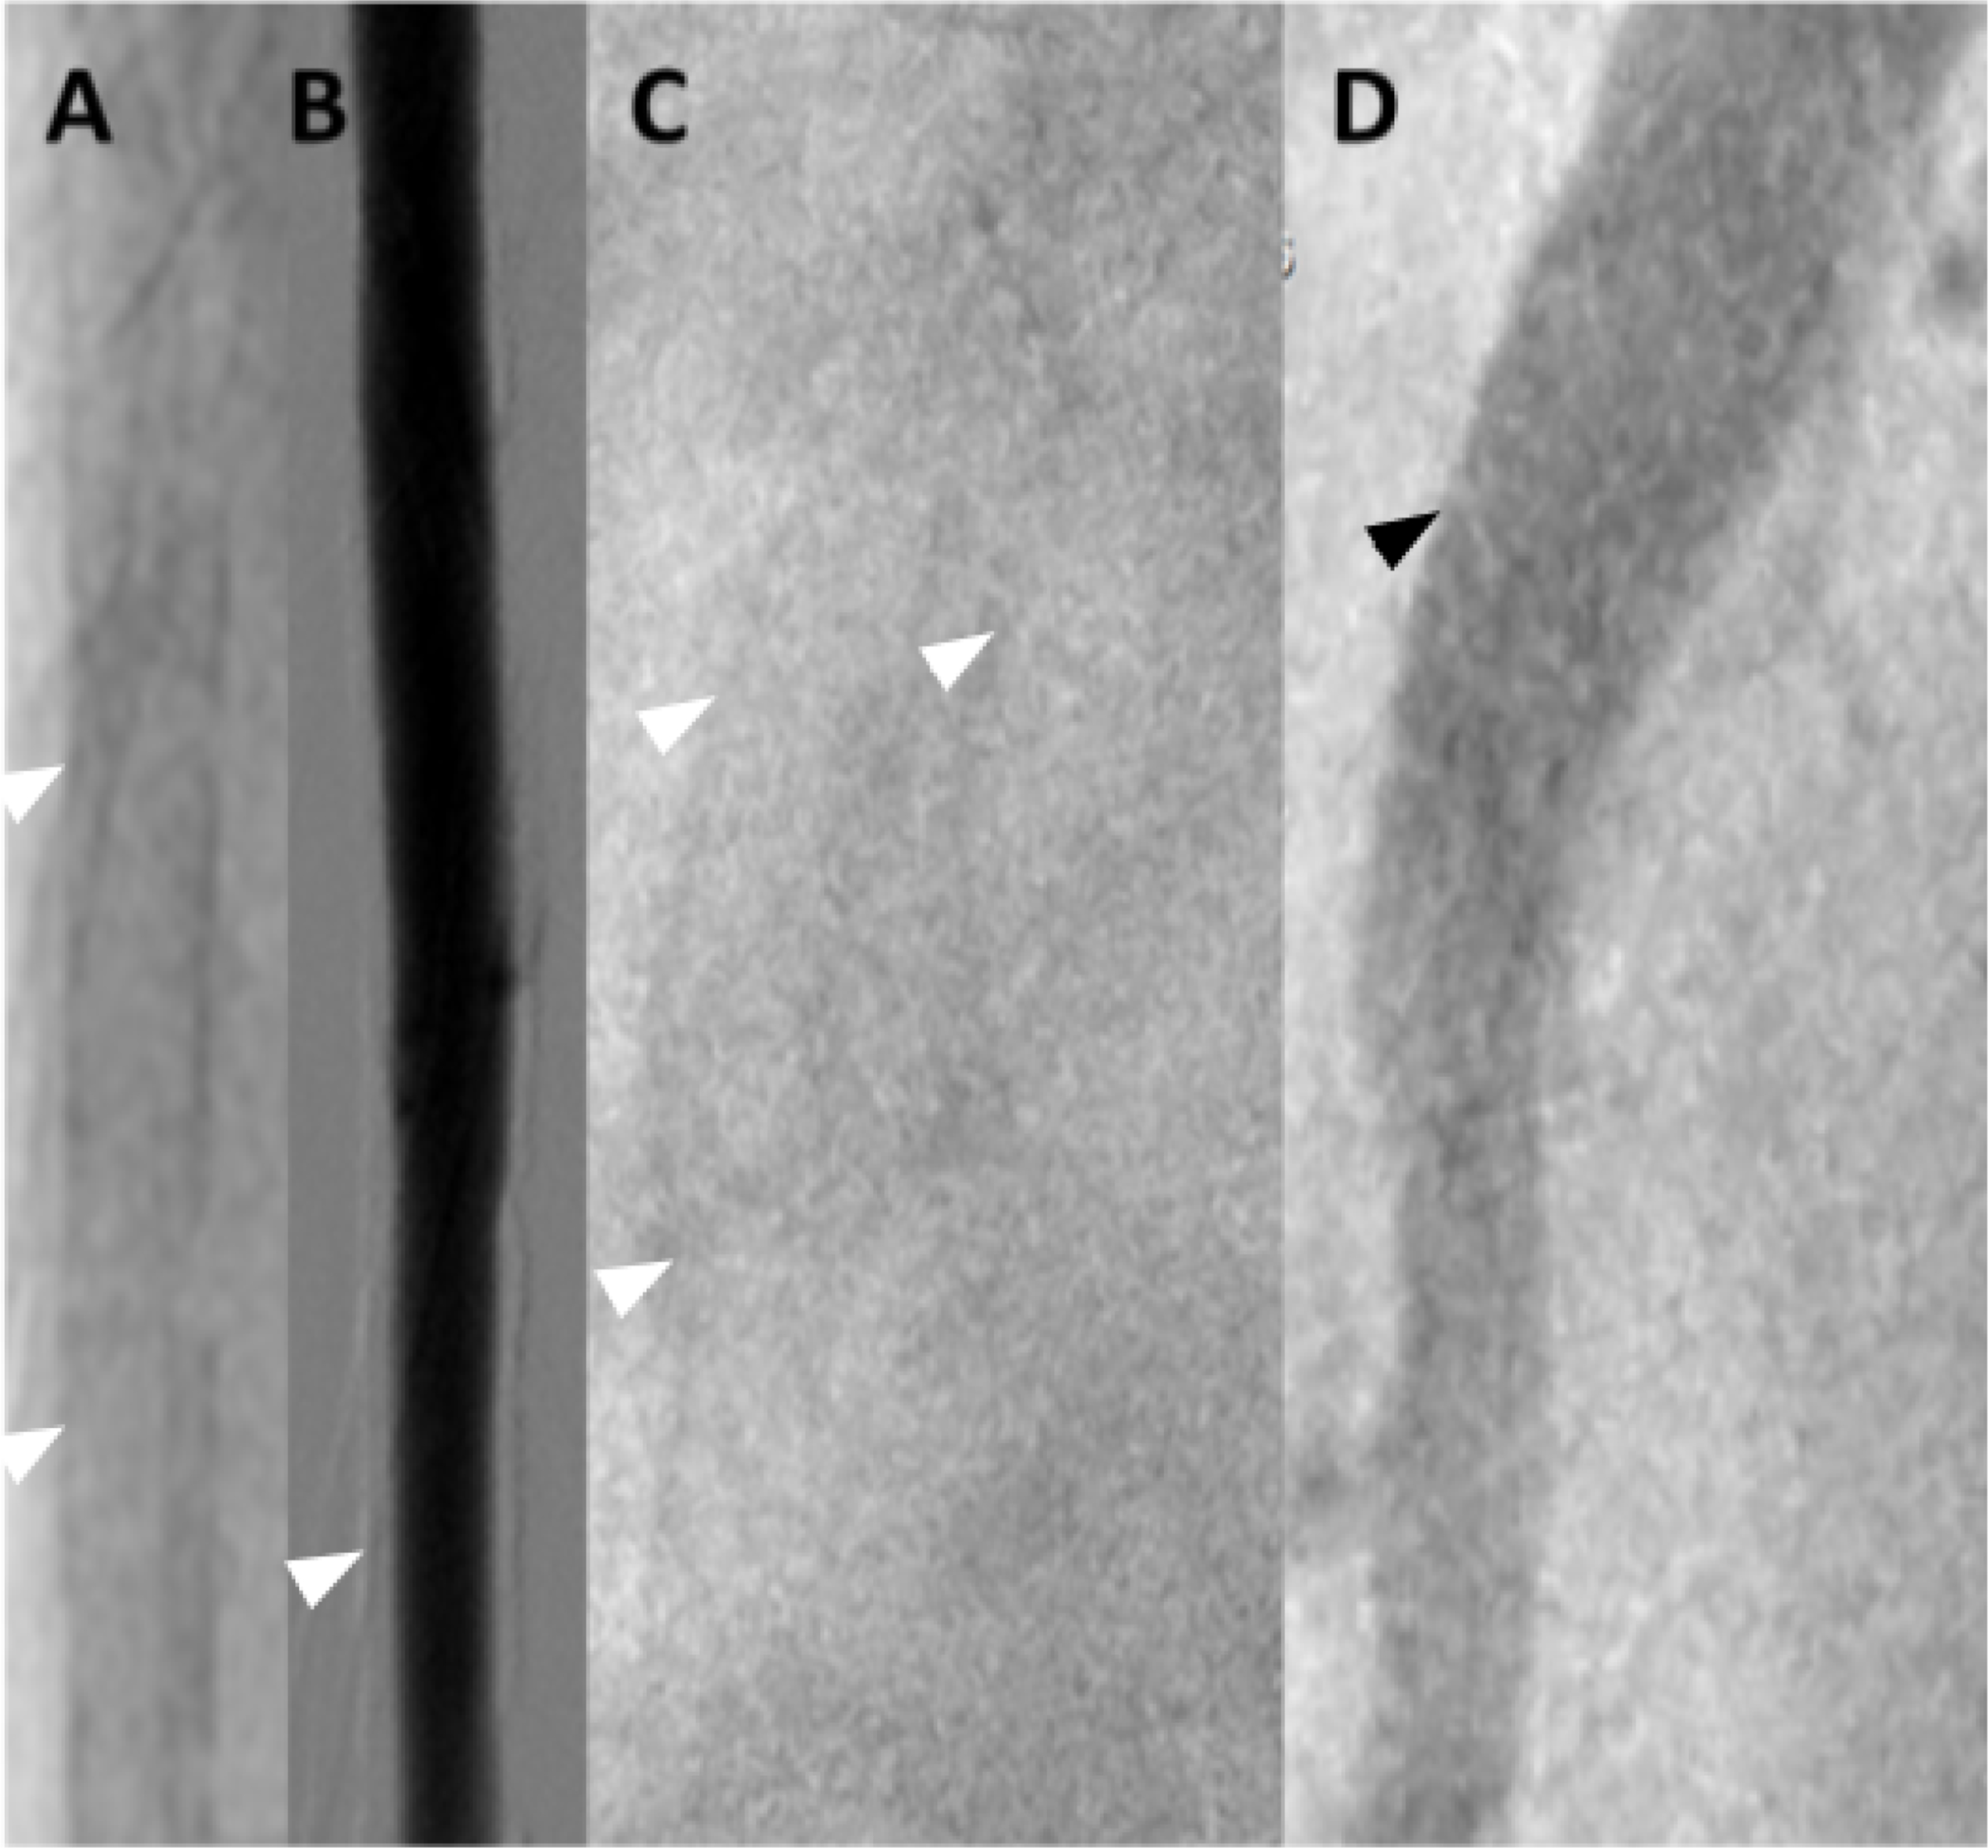
Figure 5. MAC in native X-ray and X-ray angiographic images.

(A, B) Male with diabetes mellitus and MAC demonstrated by X-ray imaging. (A) native X-ray image of the right brachial artery demonstrating the typical “rail-road track” pattern of calcification parallel to the humerus, white arrowheads at the edge of calcifications (B) X-ray angiographic image of A showing the smooth endothelial interface following contrast media filling, heavy calcification are recognized as white stripes along the lumen (white arrowhead). (C, D) Male with cardiac arrhythmias undergoing coronary angiography. (C) High resolution native X-ray image of the right coronary artery reveals disseminated pattern of calcifications (two white arrowheads on the left) suggestive of MAC seen in A; the image appears partly duplicated due the rapid motion of the cardiac base (white arrowhead on the right). (D) X-ray coronary angiographic image of C showing the smooth endothelial interface demarcated by homogeneous contrast media filling (black arrow).
