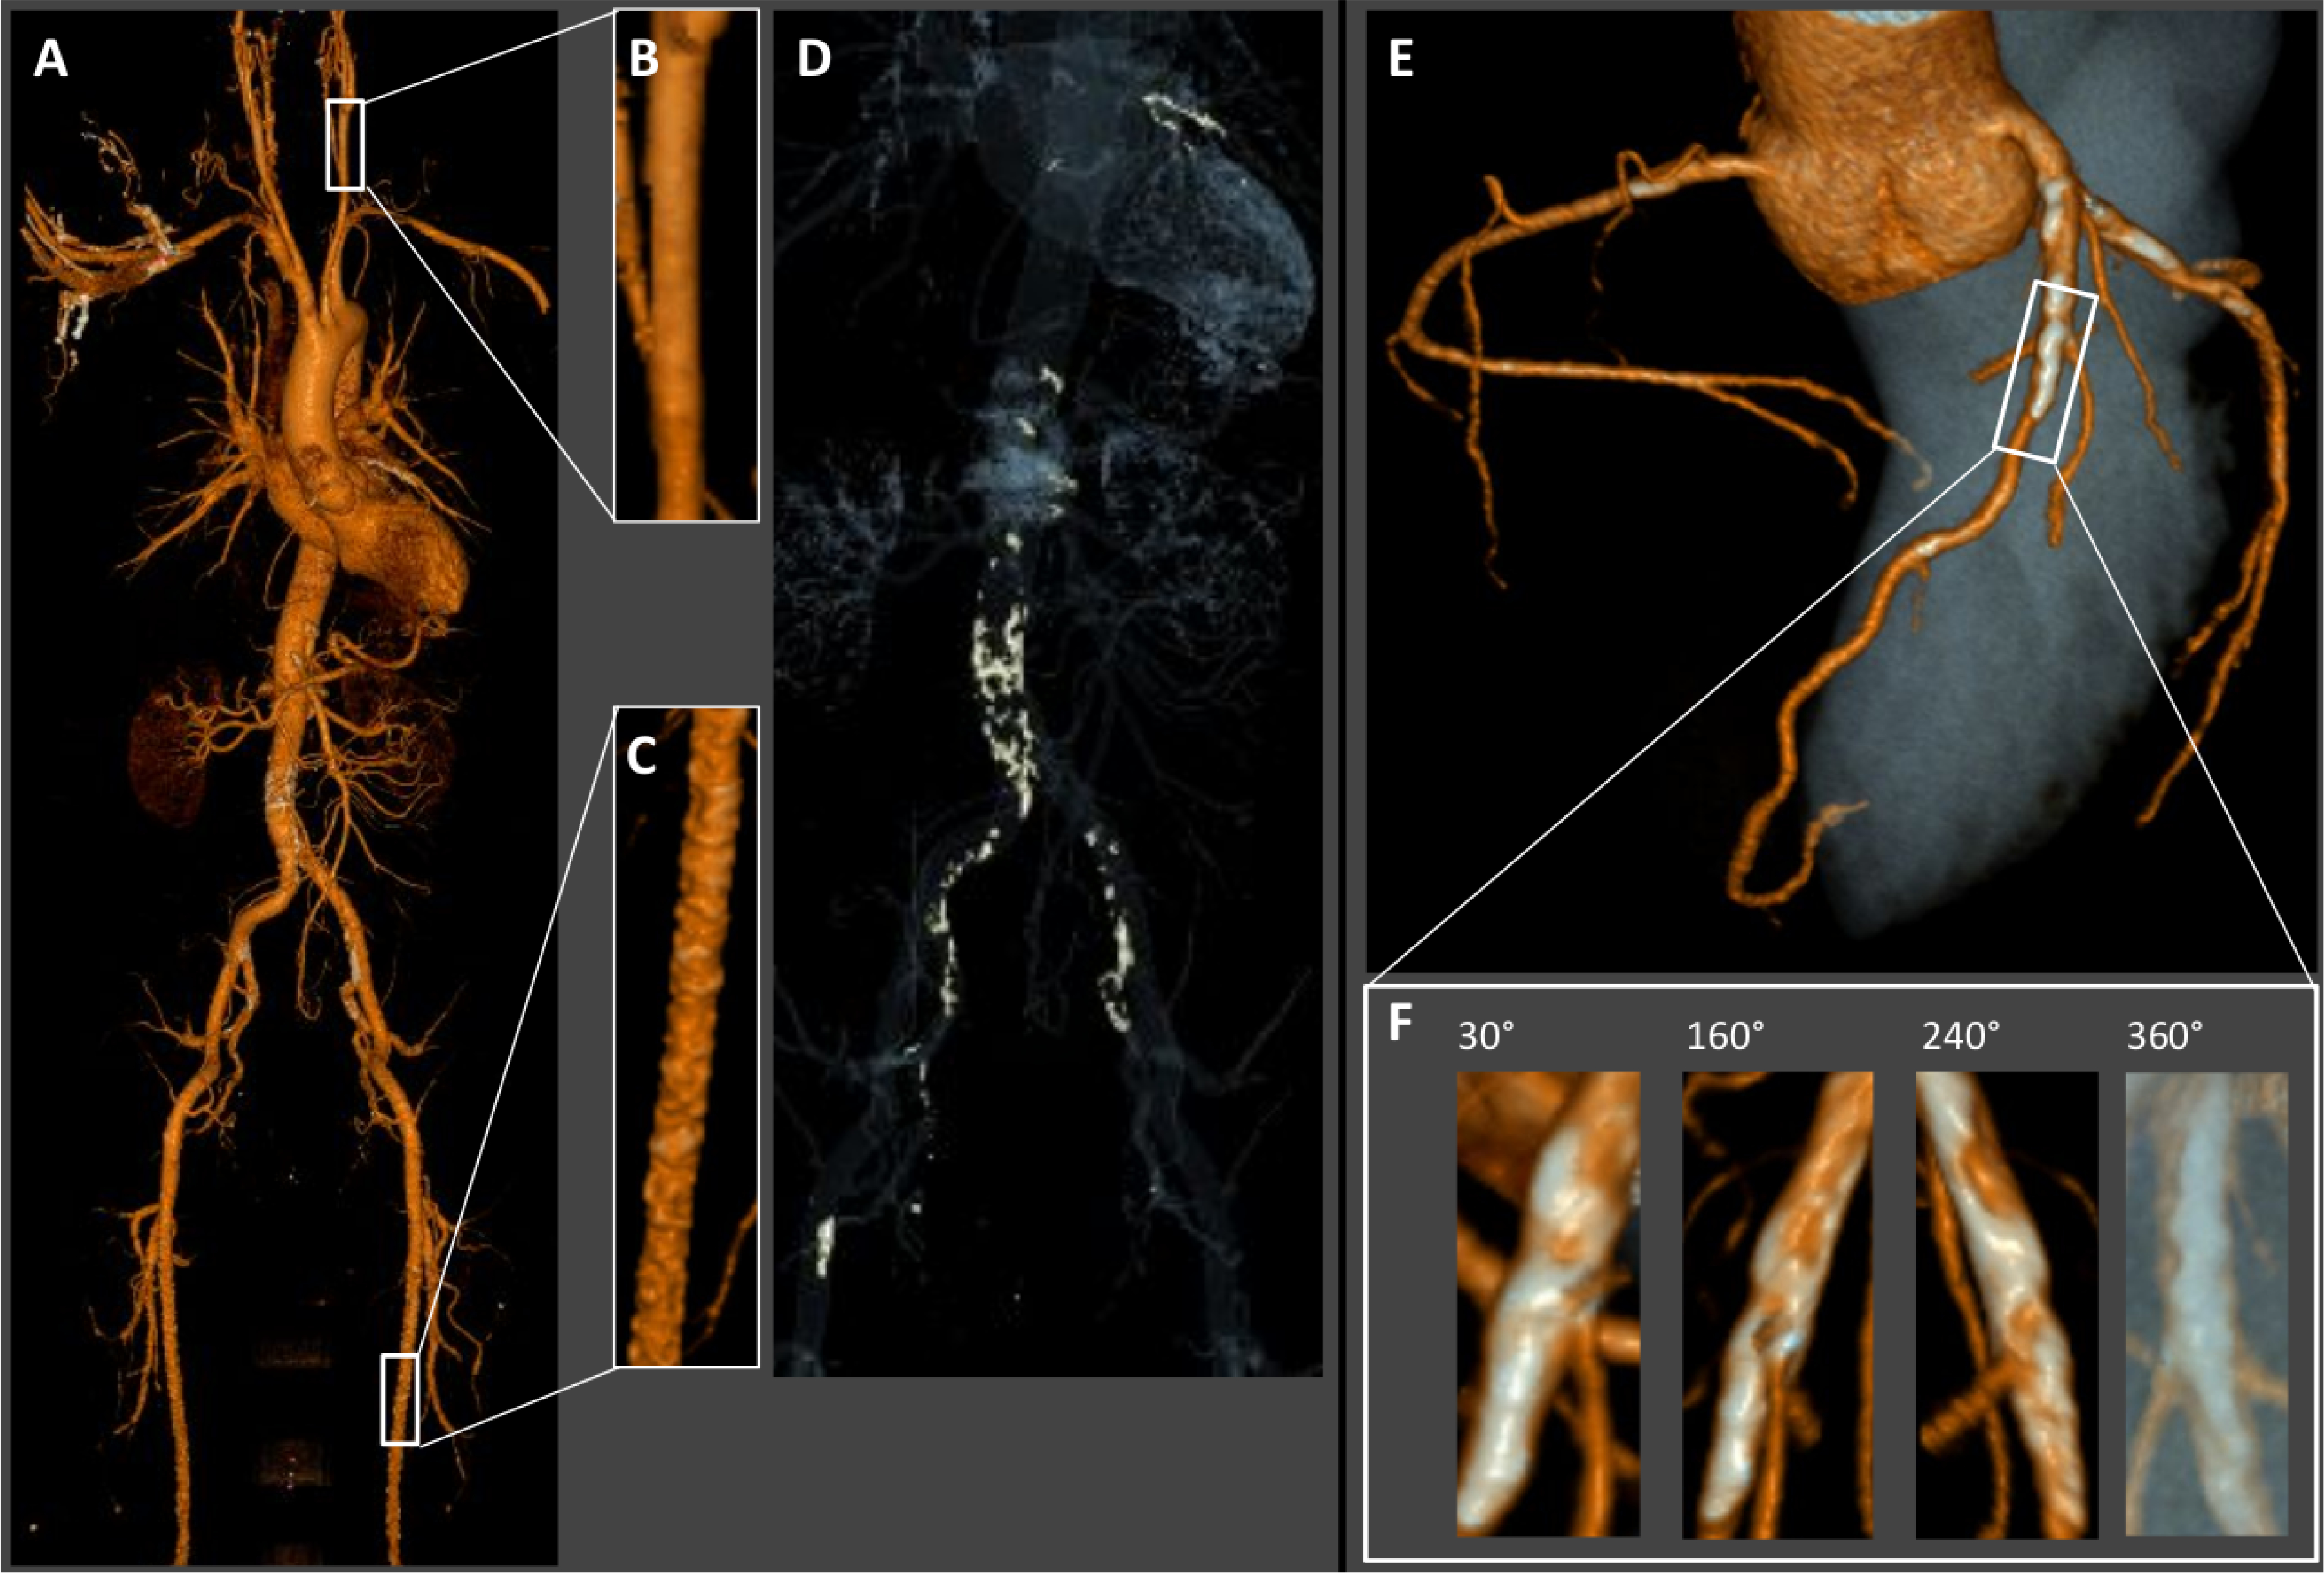
Figure 6. MAC in Computed Tomography.

3D CT reconstruction surface rendering in a male with MAC. (A) Whole body scan reveals calcifications (white spots) within the abdominal aorta, pelvic and leg arteries. (B) Enlarged section of the internal carotid artery from A appears relatively free from calcifications. (C) Enlarged section of the superficial femoral artery with heavy diffuse calcification typical for MAC. (D) Calcium windowing highlights the calcifications of the vasculature. (E) Coronary CT- angiography shows extensive calcifications of the proximal left anterior descending (LAD) coronary artery and lesser calcifications of the proximal right and left circumflex coronary arteries. (F) Enlarged section of the proximal LAD shows heavy confluent, partly circumferential calcifications.
