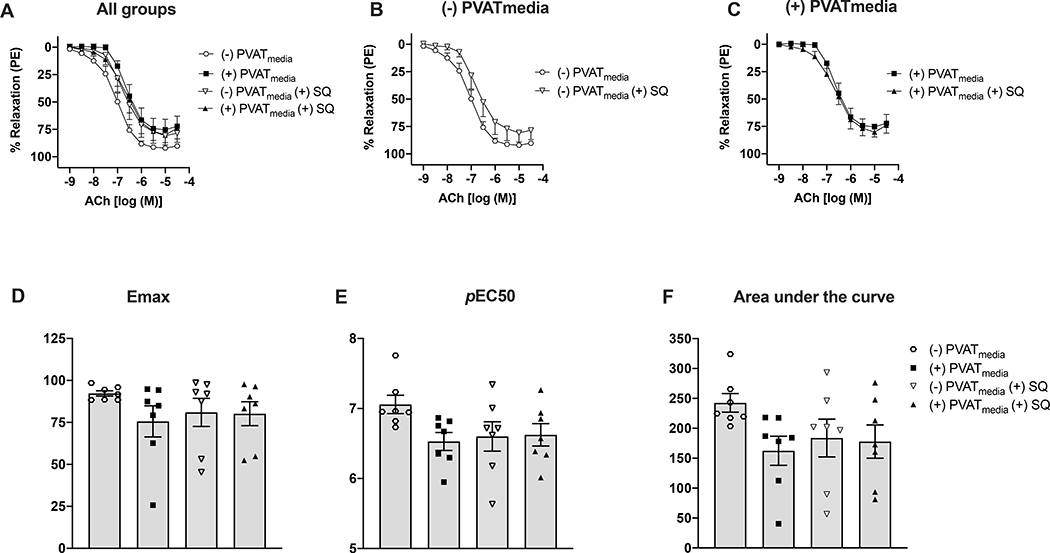
Figure 6. Effects of TP receptor inhibition on ACh-induced relaxation in uterine arteries exposed to PVAT-derived factors in pregnant rats.
(A) All treatments; (B) Concentration-response curves to ACh in the presence or absence of SQ 29,548 (no PVATmedia added); (C) Concentration-response curves to ACh in the presence or absence of SQ 29,548 (PVATmedia added); ((D) Maximum responses (Emax) to ACh for all concentration-response curves; (E) Negative logarithm of EC50 (pEC50) for all concentration-response curves; (F) Area under the curve for all concentration-response curves. Values are mean ± SEM. One-way ANOVA followed by Tukey’s post hoc test. ACh, acetylcholine; PVATmedia, perivascular adipose tissue conditioned media; TP, thromboxane receptor.

