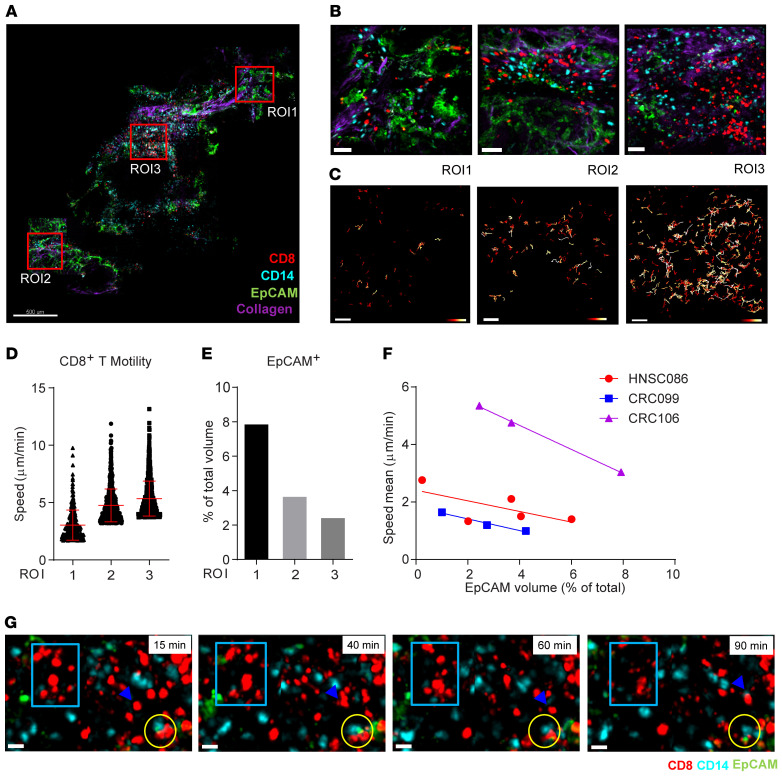
Figure 2. Inverse correlation of CD8+ T cell motility with tumor density in cancer biopsies.
(A) A scan of a colorectal cancer slice. Scale bar: 500 μm. (B) Three ROIs from panel A. Scale bars: 50 μm. (C) Color-coded track displacement of CD8+ T cells. Length range: 0.5 μm (red) to 25 μm (white). Scale bars: 50 μm. (D) The speed of the top 10% fastest CD8+ T cells was plotted. Data indicate the mean ± SD. (E) Percentage of the EpCAM+ volume in the total volume. (F) The mean speed of CD8+ T cells from 3 tumor samples plotted, respectively, against the tumor cell density of the corresponding ROIs from the biopsy. (G) Time-lapse images of a video recording of ROI2 showing CD8+ T cell movement (blue rectangles) and a T cell that moved to a CD14+ cell (blue arrowheads). T-APC-tumor cell conjugates remained through 90 minutes (yellow circles). See also Supplemental Video 2.

