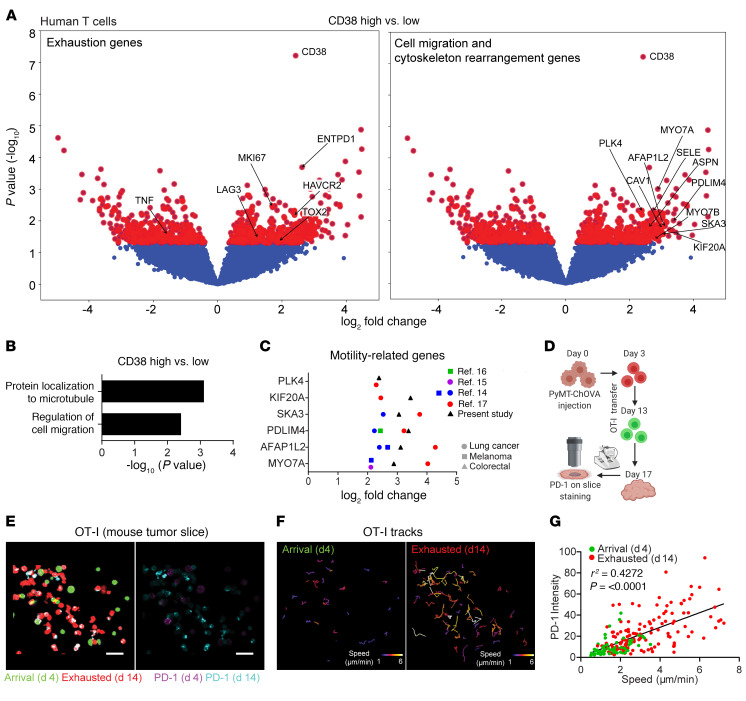
Figure 4. Exhausted T cells exhibit motile features.
(A) Volcano plots of differentially expressed genes between CD38hi (top 33rd percentile of all samples) and CD38lo (bottom 33rd percentile) CRC samples. Red dots are above the cutoff for P = 0.05. (B) Gene ontology analysis of the upregulated genes in the CD38hi versus CD38lo samples. (C) Fold-change of promotility genes in exhausted versus nonexhausted T cells from RNA-Seq of melanoma or lung cancer samples as reported in refs. 14–17. (D) Schematic diagram of the experimental design for E–G. (E) Representative images of PD-1 staining for RFP (d14) and GFP in OT-I cells (d4) that resided in the same field. Scale bars: 30 μm. (F) Speed-based, color-coded track displacement of GFP and RFP OT-I cells. (G) PD-1 intensity on OT-I cells was plotted against the mean speed of each cell. Data were pooled from 3 different ROIs and are representative of 2 independent experiments. P and r2 values were obtained by linear regression analysis.

