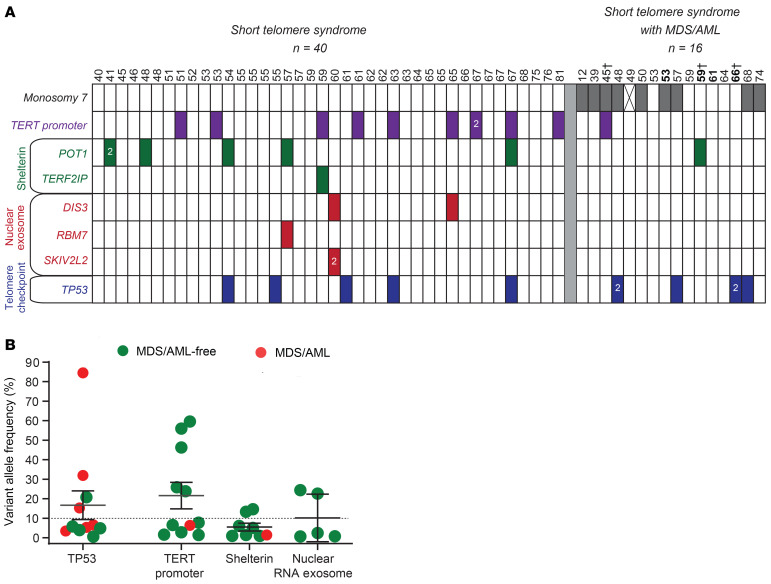
Figure 3. Prevalence of mutations relative to age and MDS/AML diagnoses.
(A) Chart showing age above and mutant gene identified in each column. Monosomy 7 refers to patients who had any chromosome 7q abnormality including -7, del(7q), or der(1;7) (q10;p10) as determined by karyotype. For patient indicated with X, karyotype information was not available. Ages in bold refer to individuals for whom DNA was derived from a bone marrow aspirate. †Patients who were analyzed for only the 3 most commonly mutant genes on a clinical panel; all others were sequenced on the customized panel. (B) Clone size is plotted by mutant gene or gene group as defined in the labels on the left in A.

