. 2021 Sep 9;10:e65304. doi: 10.7554/eLife.65304

Figure 4. Lumbar corticospinal postsynaptic neurons encode dorsal root potentials (DRPs) but no movements.

(A) Experimental design: the targets of the corticospinal tract (CST) are labeled through a transynaptic approach consisting of AAV2/1-CBA-WGA-CRE injection in the hindlimb sensorimotor cortex of TdTomato-flex mice. (B) Localization of the spinal targets of the CST: heatmap showing the distribution of the neurons in the lumbar cord (6 mm long) projected into the transverse plane (average of nine mice; left) or horizontal plane (average of six mice; right) plane. (C) Left: diagram illustrating that only lumbar direct targets of the CST express CHETA in the following experiment. Right: experimental design: TdTomato-flex mice received an injection of AAV2/1-CBA-WGA-CRE in the hindlimb sensorimotor cortex and an injection of AAV9-Efl-flex-CHETA-eYFP in the L4 spinal segment. (D) Photomicrographs (z projection of confocal images) from the dorsal horn of the spinal cord (laminae V/VI); the arrows point at two targets of the CST expressing TdTomato+ and CHETA-eYFP. (E) Experimental design illustrating spinal photostimulation of the lumbar targets of the CST. (F) Representative traces of DRP (red trace, average of 60 traces) and electromyographic (EMG; blue trace, average of three traces) recordings from the same animal after photostimulation of the lumbar targets of the CST (blue window). (G) Photostimulation of the lumbar targets of the CST induces DRPs (left) but no EMG signal (right). Gray zone: noise level (see Materials and methods). EMG Z-scores for individual mice are presented in Figure 2—figure supplement 2. SMC: sensorimotor cortex; BSMN: brain stem motor nuclei; C-Th: cervico-thoracic spinal cord; L-SC: lumbo-sacral spinal cord.

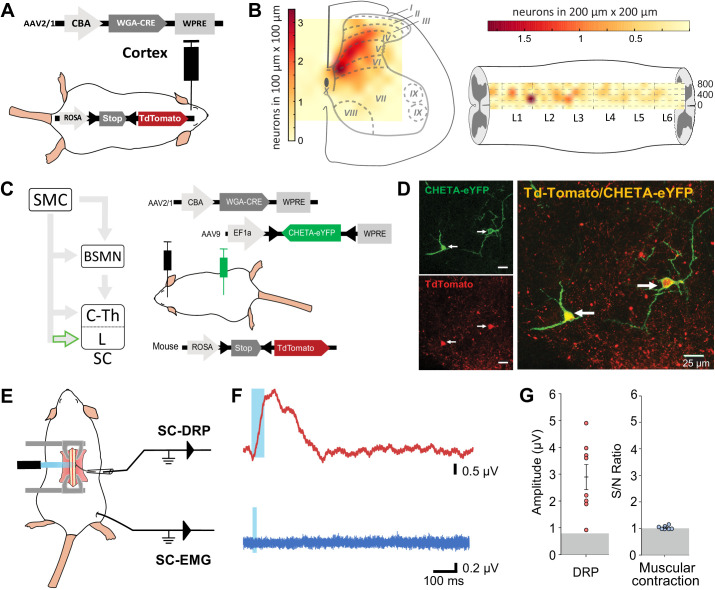
Figure 4.

Figure 4—figure supplement 1. Strategy to label the spinal targets of corticospinal (CS) neurons.

Figure 4—figure supplement 1.

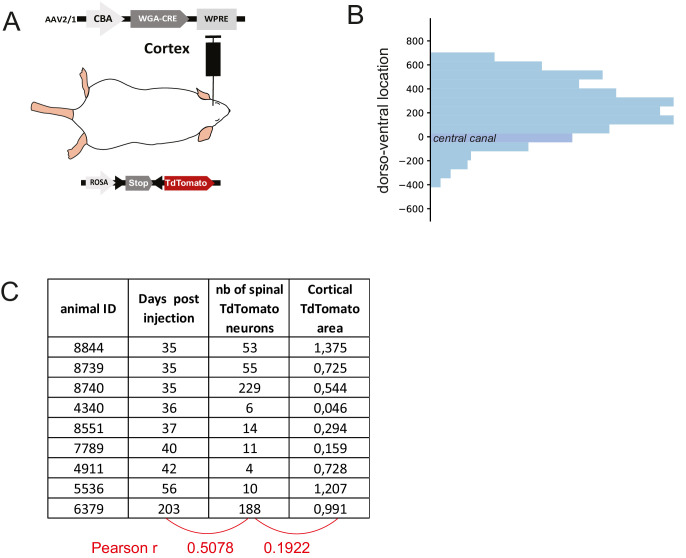
(A) Experimental design: the targets of the corticospinal tract (CST) are labeled through a transynaptic approach consisting of AAV2/1-CBA-WGA-CRE injection in the hindlimb sensorimotor cortex of TdTomato-flex mice. (B) Dorsoventral distribution of TdTomato neurons in the spinal cord after transynaptic labeling. N = 570 neurons from nine animals. The 0 coordinate corresponds to the center of the central canal. 85% of neurons are located dorsally to the central canal. (C) Total number of TdTomato neurons in the lumbar spinal cord (systematic counting) in the different animals considered for building Figure 4A, including indication of survival delay after cortical injection, and infected area (in mm2) in the cortex after histological analysis. These parameters do not correlate with the number of TdTomato neurons as demonstrated by the low Pearson coefficient.
Figure 4—figure supplement 2. Strategy to stimulate exclusively the spinal targets of corticospinal (CS) neurons.

Figure 4—figure supplement 2.

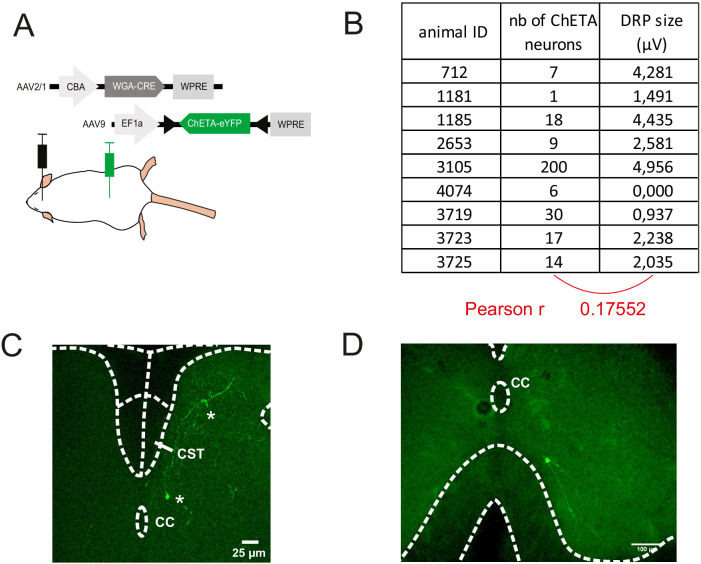
(A) Experimental design: the targets of the corticospinal tract (CST) are labeled through a transynaptic approach consisting of AAV2/1-CBA-WGA-CRE injection in the hindlimb sensorimotor cortex of TdTomato-flex mice. (B) Number of ChETA-expressing targets of the CST and size of dorsal root potential (DRP) signal recorded in the corresponding mice (no correlation). These numbers are underestimated as the histological analysis was performed after a long recording session, with only post-fixation (no intracardiac perfusion of fixative). (C) After the transectional approach presented in (A), the spinal postsynaptic targets of CS neurons express ChETA-eYFP (two *). Importantly, the dorsal funiculus, and in particular the CST, is not labeled by this approach. CC: central canal. (D) The spinal CS postsynaptic neurons (that received the transynaptic WGA-Cre) infected by the intraspinal AAV injection (encoding ChETA-flex) can be located in the ventral horn, as in this example of a neuron located at 180 μV ventral to the CC. Neurons up to –230 μV from the CC were infected, that is, a depth where 97% of the spinal targets of the CS neurons are found (Figure 4—figure supplement 1B).
Figure 4—figure supplement 3. Efficacy of the surface spinal photostimulation.

Figure 4—figure supplement 3.

(A) Experimental design (left) for LFP recordings (right): the lumbar targets of the corticospinal tract (CST) express ChETA after intersectional viral strategy, and LFP recording are obtained at different depth after spinal surface photostimulation. (B) Experimental design (left) for spinal single unit (right top) and electromyographic (EMG; right bottom) recordings in Thy1-ChR2 mice, after spinal surface photostimulation (isoflurane anesthesia). (C, left) Depth of neurons recorded by juxtacellular single-unit recordings, directly responding to the surface illumination (1 ms or 0.5 ms pulse). Right: Criteria to establish that these neurons were directly activated: the delay of the response was lower than 5 ms, the standard deviation of this delay was lower than 0.20 ms, and (not shown) there was no failure (or less than 0.5% of failure) when stimulated at 4 Hz. (D) Example of a spinal neuron located at 500 μm from the cord surface. (D1) Superimposition of electrophysiological traces of the photostimulated action potential. (D2) Raster plot of the 1000 episodes illustrating the stability of the response and of its delay. (D3) Peristimulus histogram presenting the distribution of the spike delay of this neuron in the 1000 episodes presented in (D2). Note: In contrast to the spinal photostimulation presented here, cortical photostimulation of THY1 animals under isoflurane anesthesia did not lead to an EMG signal; this was only obtained under ketamine/xylazine anesthesia.