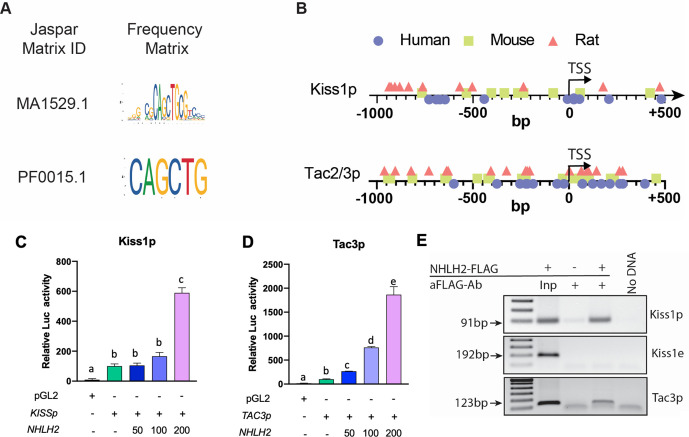
Figure 2. NHLH2 is recruited to and stimulates KISS1 and TAC3 promoter activity.
(A, B) Identification of NHLH2 biding sites in Kiss1 and Tac2/3. NHLH2 DNA recognition sites as identified in two Jaspar matrices (A). Distribution of NHLH2 binding sites in human, mouse, and rat Kiss1 promoters (Kiss1p) and TAC2/3 promoters (Tac2/3 p) (B). (C–E) Effect of NHLH2 on luciferase activity regulated by the human KISS1 (C) and TAC3 (D), promoter (p). Neuro-2a cells were transfected with luciferase reporter constructs containing the 5′ flanking region of the indicated genes. After 48 h, the cells were harvested and assayed for luciferase activity. Bars represent mean± SEM (n=three biological replicates per group). Groups with different letters are significantly different (P<0.05), as determined by one-way ANOVA followed by the Student-Newman-Keuls test. (E) Association of NHLH2 with the 5′ promoter region of the KISS1 (Kiss1p) and TAC3 (Tacr3p) genes as determined by PCR amplification of DNA immunoprecipitated with antibodies recognizing the FLAG/OctA epitope tagging NHLH2. As negative control, a region of the Kiss1 promoter outside of the area containing Nhlh2 E-box was assayed (Kiss1e). Inp=Input. Data presented as the mean± SEM.

