. 2021 Sep 14;10:e69269. doi: 10.7554/eLife.69269

Figure 3. CNBP regulates the ornithine decarboxylase (ODC)/polyamine axis.

Levels of both Odc and putrescine are significantly reduced in dCNBP-depleted larvae compared to wild-type controls. (A) Immunoblot showing the levels of both dCNBP and dOdc in extract obtained from tubGAL4>2XdCNBPRNAi third instar larvae compared to control (no UAS), with the corresponding band quantification normalized on the loading control (IMAGE J 1.50i; quantification data in source data for western blot [WB] quantification). Actin, loading control. A.U., arbitrary unit. (B) Columns represent the fold difference of putrescine content in third instar larvae bearing the c179GAL4 driver alone (no UAS) or in combination with double copy dCNBP RNAi-expressing larvae (UAS-dCNBPRNAi-16283; UAS-dCNBPRNAi-16284, named 2XdCNBPRNAi). Error bars represent SEM; ***p>0.001, ** p>0.002, in unpaired t-test. A pool of 10 larvae has been tested for each genotype in three independent experiments. Full data in Figure 3—source data 1.

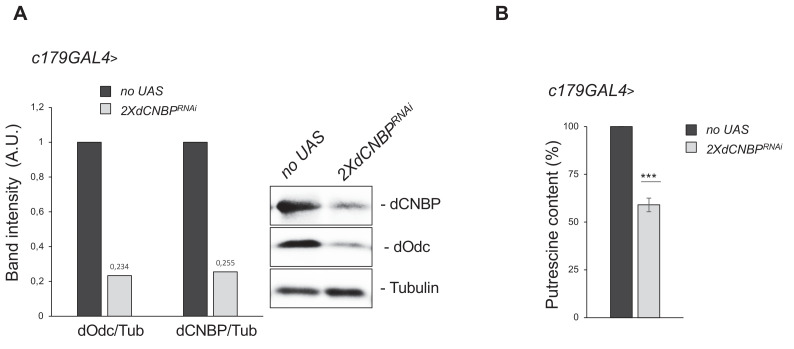
Figure 3—source data 1. Putrescine content quantification as shown in Figure 3B and Figure 3—figure supplement 1B.

Figure 3.

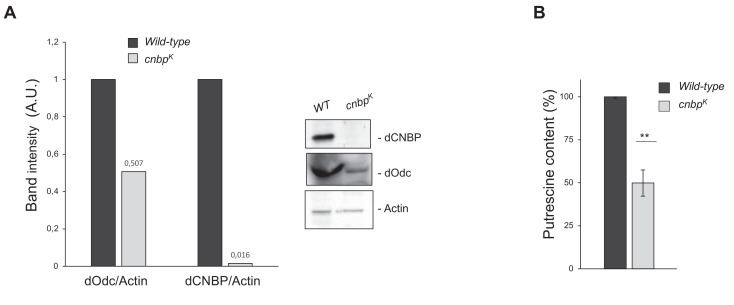
Figure 3—figure supplement 1. Larval locomotor defect observed in cnbpk mutants correlates with the reduction of ornithine decarboxylase (Odc) protein and polyamine levels.

Figure 3—figure supplement 1.

Levels ofOdc protein and polyamine are significantly reduced in dCNBP mutant larvae compared to wild-type (WT) controls. (A) Immunoblot showing the levels of both dCNBP and dOdc in extract obtained from WT and cnbpk mutant second instar larvae, with the corresponding band quantification normalized on the loading control (IMAGE J 1.50i; quantification data in source data for western blot [WB] quantification). Actin, loading control. (B) Columns represent the fold difference of putrescine content in second instar larvae of cnbpk mutant compared to controls (WT). Error bars represent SEM; **p>0.002, t-test. A pool of 10 larvae has been tested for each genotype in three independent experiments. Full data in Figure 3—source data 1.