Figure 4. Ornithine decarboxylase (Odc) depletion phenocopies the dCNBP locomotor defects.
Box plot representation of the distribution of peristaltic contraction rates performed by third instar larvae of the reported genotypes in 1 min. (A) c179GAL4>no UAS, UAS-Odc1RNAi-30039, UAS-Odc2RNAi-10459, UAS-Odc2RNAi-10459; UAS-Odc1RNAi-30039, or UAS-dCNBPRNAi-16283; UAS-dCNBPRNAi-16284. In the graph legend UAS in transgenic RNAi lines is omitted for simplicity. (B) Controls (wild type) and dOdc1MI10996 mutant larvae. (C) Controls fed with standard fly food (wild type) or after DFMO treatment (5 mM/day; wild type + DFMO). The line inside the box indicates the median for each genotype and box boundaries represent the first and third quartiles; whiskers are min and max in the 1.5 interquartile range (**p<0.001; ****p<0.0001; ns, not significant, Kruskal-Wallis with post hoc Dunn’s test for multiple comparison or Mann-Whitney-Wilcoxon test for); ≥10 larvae tested for each genotype in at least three independent experiments. All full data in Figure 4—source data 1.

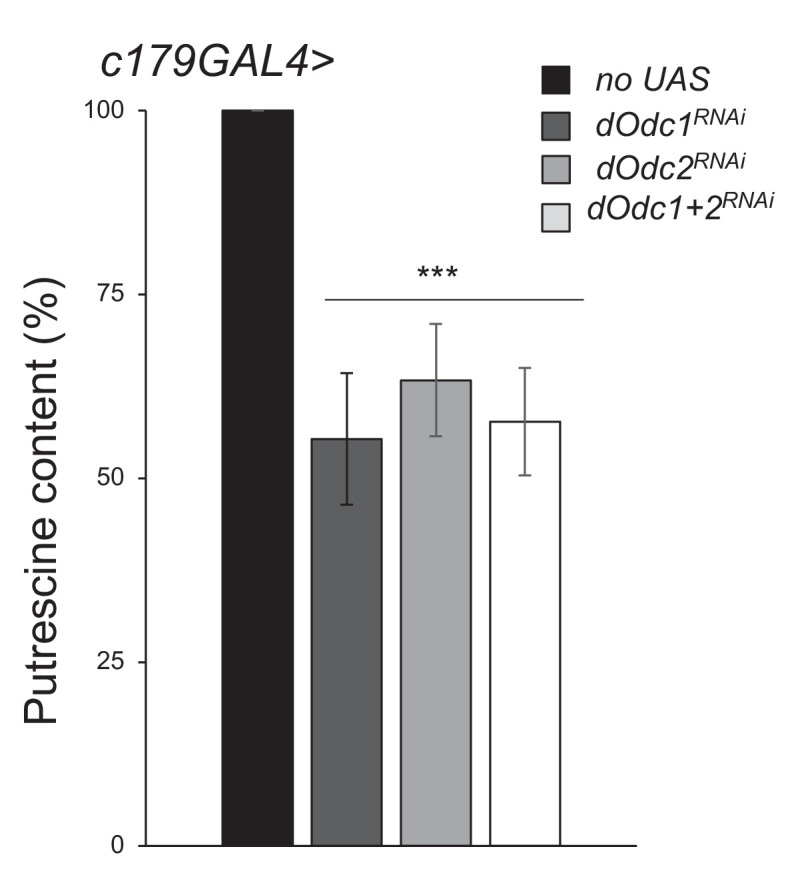
Figure 4—figure supplement 1. Larval locomotor defect observed as a consequence of ornithine decarboxylase (Odc) depletion correlates with the reduction of polyamine levels.