. 2021 Sep 14;10:e69269. doi: 10.7554/eLife.69269

Figure 6. dCNBP controls polyamine metabolism through the binding and the translational control of dOdc mRNA.

(A) dOdc1 mRNA levels (qPCR), normalized with the housekeeping RPL11 mRNA third instar larvae bearing c179GAL4 driver alone (no UAS) or in combination with UAS-dCNBPRNAi-16283; UAS-dCNBPRNAi-16284 (2XdCNBPRNAi). ns, not significant in unpaired t-test. Dots correspond to four independent biological replicates; bars indicate the mean and SEM. (B) Cellular nucleic acid-binding protein (CNBP) binds dOdc1 mRNA. qRT-PCR analysis on mRNAs immunoprecipitated by anti-dCNBP antibody or control IgG antisera in S2 cells extracts (left graph), or in dCNBP-depleted (2XdCNBPRNAi) or not (no UAS) larval extracts (right graph). The results are indicated as fold difference, relative to IgG. Error bars represent SEM of three independent experiments; *p < 0.05, in t-test. The presence of dCNBP in c179GAL4>2XUASdCNBPRNAi or control (no UAS) larval carcasses was analyzed by western blotting (right). Tubulin, loading control. (C) Representative polysome profiles (of at least three independent experiments) of dCNBP-deficient (dCNBPRNAi) or control (CTRL) S2 cells. Cytoplasmic lysates were fractionated on 15–50% sucrose gradients. (D) qPCR analysis of dOdc1 mRNA loaded in the different polysome fractions, GADPH was used to normalize the values. (*p < 0.05, t-test. Error bars represent SEM of experiments performed in quadruplicates and repeated at least three times.) The presence of dCNBP in interfered or not interfered S2 cells was analyzed by western blotting (right). Tubulin, loading control. All full data in Figure 6—source data 1.

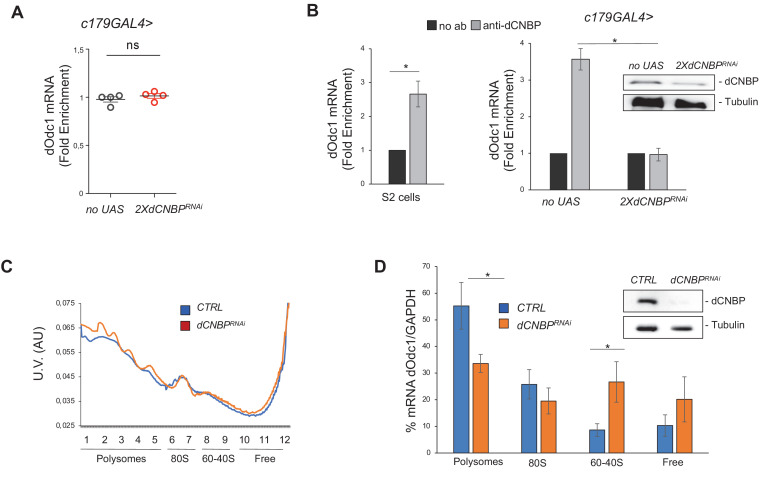
Figure 6—source data 1. Real-time qPCR data as shown in Figure 6A, B, D, in Figure 6—figure supplement 1A-B and in Figure 6—figure supplement 4B; polysome profile data as shown in Figure 6C.
elife-69269-fig6-data1.xlsx (198.6KB, xlsx)

Figure 6.

Figure 6—figure supplement 1. dCNBP does not control polyamine metabolism through dOdc1 internal ribosome entry site (IRES)-dependent translation.

Figure 6—figure supplement 1.

(A) Schematic representation of the bicistronic CMV-renilla-TAA/dOdc1-IRES-firefly luciferase (dOdc1-luc) vector (top). The renilla ORF is translated via conventional cap-dependent mechanism, whereas translation of the luciferase ORF is controlled by the dOdc1 5’UTR sequence. IRES activity of dOdc1-luc which is not significantly modulated by dCNBP overexpression compared to the empty vector (bottom). Columns represent the fold changes of luciferase activity, normalized to the renilla expression. Error bars represent SEM; ns: no significant with Student’s t-test, of three independent experiments. (B) Schematic representation of a bicistronic CMV-renilla-TAA/hODC-IRES-firefly luciferase (hODC-luc) vector (top). IRES activity of hODC-luc which is significantly modulated by both dCNBP or hCNBP overexpression, compared to the empty vector (bottom). Columns represent the fold changes of luciferase activity, normalized to the renilla expression. Error bars represent SEM; p<0.05 with Student’s t-test, of three independent experiments. All full data in Figure 6—source data 1.
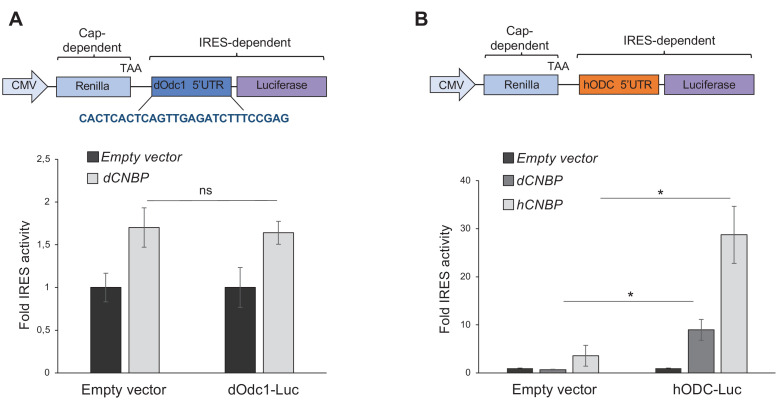
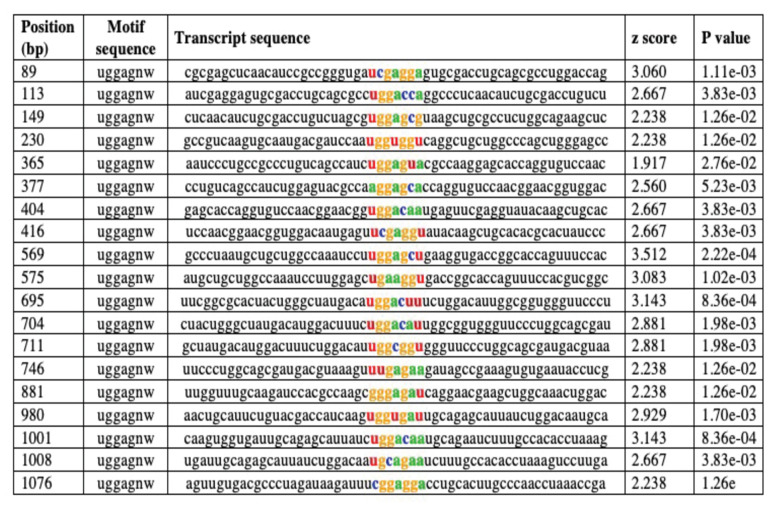
Figure 6—figure supplement 2. In silico prediction of putative cellular nucleic acid-binding protein (CNBP) binding sites on the dOdc1 mRNA by RBPmap.

Figure 6—figure supplement 2.

The dOdc1 transcript (FBtr0088863) was uploaded to the RBPmap web server for mapping binding sites. As criteria Drosophila genome, UGGAGNW consensus motif and high stringency level were used (Paz et al., 2014; http://rbpmap.technion.ac.il).
Figure 6—figure supplement 2—source data 1.
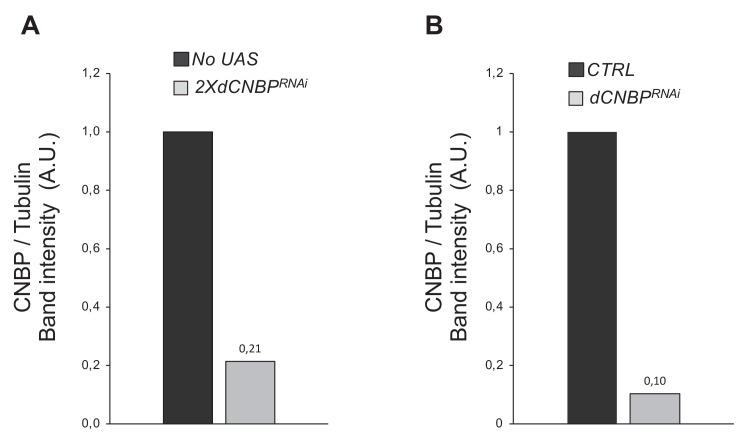
Figure 6—figure supplement 3. Efficiency of dCNBP silencing.

Figure 6—figure supplement 3.

Quantification by IMAGE J 1.50i of the levels of dCNBP in extracts (A) obtained from control larvae (no UAS) or from larvae where the UAS-dCNBPRNAi-16283; UAS-dCNBPRNAi-16284 constructs (2XdCNBPRNAi) are driven by the c179GAL4 driver (from the immunoblot shown in Figure 6B); or in extracts (B) obtained from untreated S2 cells (CTRL) or from S2 cells CNBP-interfered (dCNBPRNAi; from the immunoblot shown in Figure 6D). A.U., arbitrary unit. Quantification data in source data for western blot [WB] quantification.
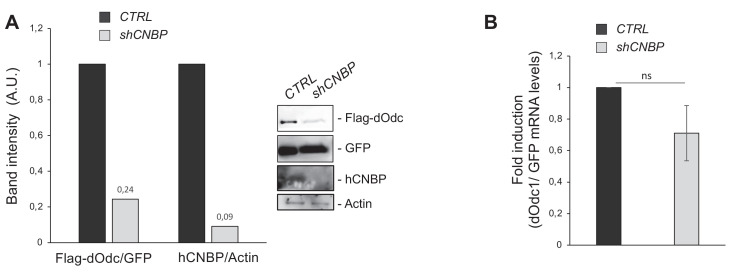
Figure 6—figure supplement 4. Cellular nucleic acid-binding protein (CNBP) promotes translation of dOdc mRNA.

Figure 6—figure supplement 4.

Effect of human CNBP (hCNBP) depletion on both dOdc protein expression and mRNA level in 293T human cells. (A) Immunoblot showing a direct correlation of hCNBP depletion with a strong reduction of dOdc protein levels, with the corresponding band quantification normalized on the loading control (IMAGE J 1.50i; quantification data in source data for western blot [WB] quantification). Actin, loading control. A.U., arbitrary unit. (B) dOdc1 mRNA levels (qPCR), normalized with the GFP mRNA levels. Error bars represent SEM of three independent experiments; ns, not significant in unpaired t-test. Full data in Figure 6—source data 1.