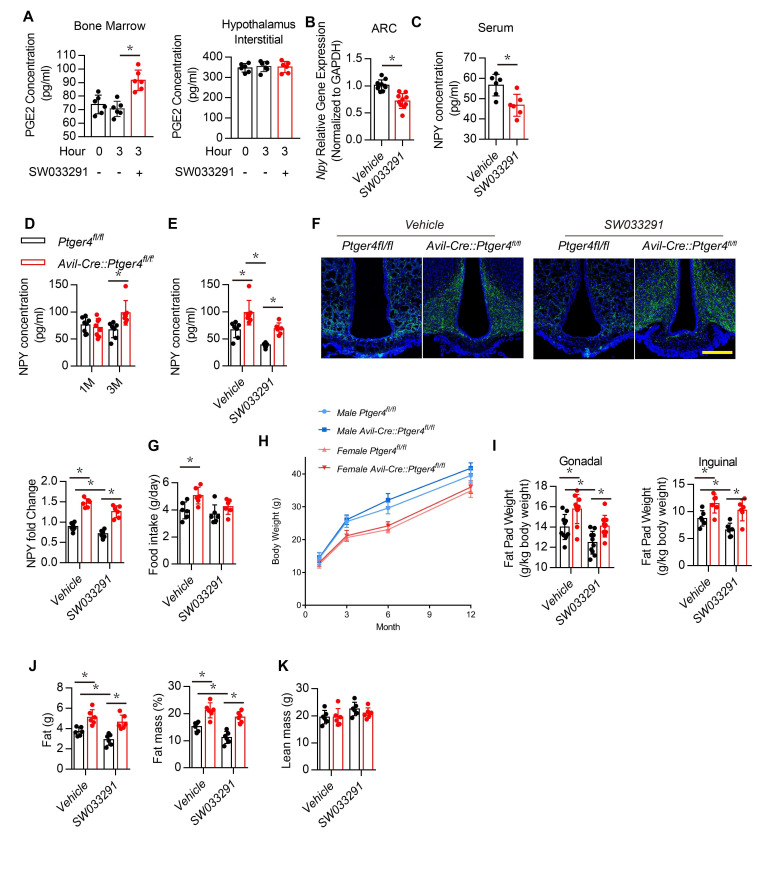
Figure 2. Deletion of EP4 receptor in sensory nerve increases NPY expression.
(A) ELISA analysis of bone marrow and hypothalamus interstitial in WT mice treated with vehicle or SW033291 for 0 and 3 hr. (B) RT-PCR quantitative analysis of Npy gene expression in the ARC area in 3-month-old male WT mice after being treated with vehicle or 10 mg/kg/d SW033291 for 1 month. (C) ELISA analysis of NPY level in serum from 3-month-old male WT mice after being treated with vehicle or 10 mg/kg/day SW033291 for 1 month. (D) ELISA analysis of NPY level in serum from 1- and 3-month-old Ptger4fl/fl and AvilCre:Ptger4fl/fl mice. (E) ELISA analysis of NPY level in serum from 3-month-old Ptger4fl/fl and AvilCre:Ptger4fl/fl mice treated with vehicle or 10 mg/kg/d SW033291 for 1 month. (F) Representative images of immunofluorescence staining and quantitative analysis of NPY (green) in the ARC of hypothalamus of 3-month-old Ptger4fl/fl and AvilCre:Ptger4fl/fl mice treated with vehicle or 10 mg/kg/d SW033291 for 1 month. DAPI stains nuclei blue. Scale bars = 50 µm. (G) Quantitative analysis of food intake for 3-month-old Ptger4fl/fl and AvilCre:Ptger4fl/fl mice treated with vehicle or 10 mg/kg/d SW033291 for 1 month. (H) Quantitative analysis of body weight for male and female Ptger4fl/fl and AvilCre:Ptger4fl/fl mice at 1, 3, 6, and 12 months old. Quantitative analysis of the weight of the (I) gonadal and inguinal fat pads isolated from 3-month-old Ptger4fl/fl and AvilCre:Ptger4fl/fl mice treated with vehicle or SW033291 for 1 month. qNMR analysis of (J) fat weight, fat mass, and (K) lean mass of 3-month-old Ptger4fl/fl and AvilCre:Ptger4fl/fl mice treated with vehicle or SW033291 for 1 month. N ≥ six per group. *p < 0.05, and N.S. means not significant. Statistical significance was determined by Student’s t-test for A–D. Statistical significance was determined by two-way analysis of variance for E-G, I-K.


