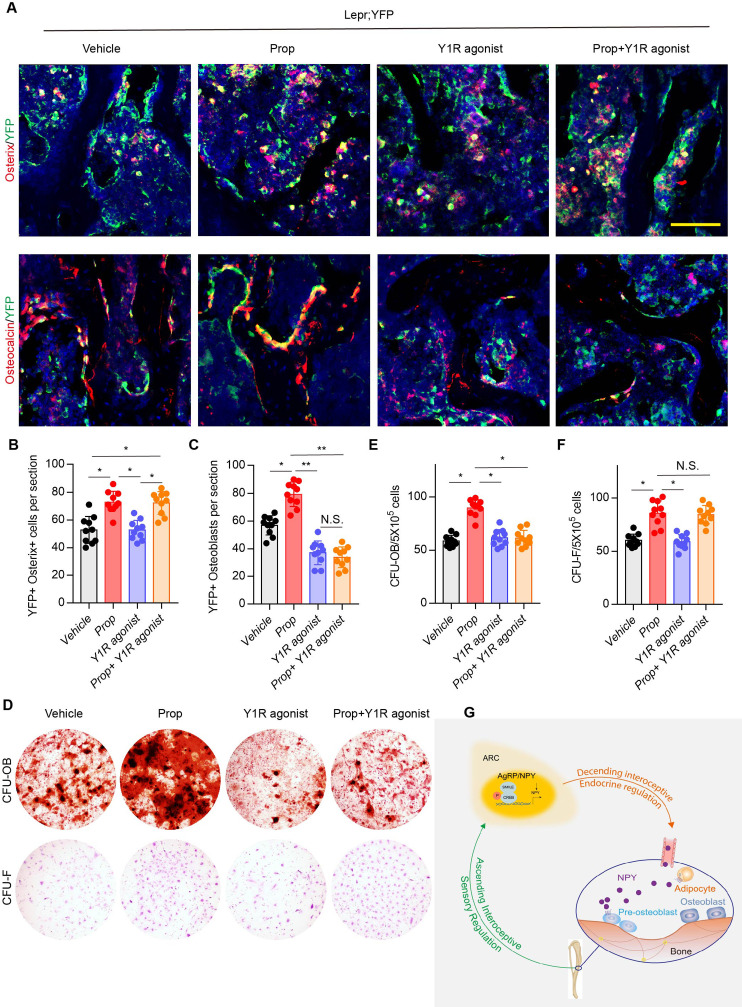
Figure 7. β2R regulates MSC commitment and Y1R coordinates osteoblastic formation and mineralization.
(A) Representative images of immunofluorescence staining of colocalization of Osterix (red) and osteocalcin (red) with YFP (green) (representing LepR+ cells) and (B, C) quantitative analysis of (B) YFP+ osterix+ cells per section and (C) YFP+ osteoblasts per section in femur bone marrow from 3-month-old Lepr;YFP mice treated with propranolol (0.5 mg/kg/day for 6 weeks), 5 μmol/mouse/day [Leu31, Pro34]-NPY, and a combination of propranolol (0.5 mg/kg/d for 6 weeks) and 5 umol/mouse/d [Leu31, Pro34]-NPY for 4 weeks. Scale bars = 50 µm. (D) Representative images of alizarin red S–stained CFU-Ob and crystal violet–stained CFU-F. Quantitative analysis of (E) CFU-Ob and (F) CFU-F MSCs isolated from 3-month-old male Lepr;YFP mice treated with propranolol (0.5 mg/kg/d for 6 weeks), 5 umol/mouse/day [Leu31, Pro34]-NPY, and a combination of propranolol (0.5 mg/kg/day for 6 weeks) and 5 umol/mouse/d [Leu31, Pro34]-NPY for 4 weeks. N ≥ six per group. *p < 0.05 and N.S. indicates not significant. Statistical significance was determined by two-way analysis of variance. (G) Diagram showing that PGE2/EP4 ascending signal also downregulates expression of neuroendocrine factor NPY, which is secreted into circulation, as the neuroendocrine descending interoceptive signal for bone and fat metabolism.

