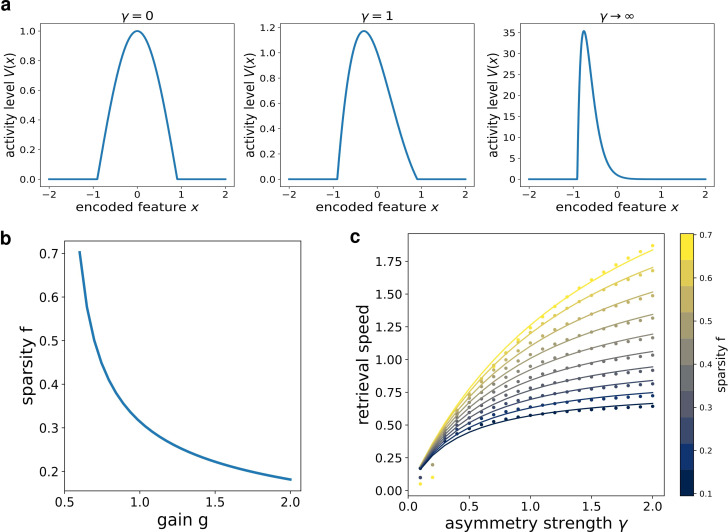
Figure 3. Analytical solution of the model.
(a) The shape of the bump for increasing values of γ. (b) Dependence of the sparsity on the gain of the network. (c) Dependence of the speed of the shift on γ, at different values of sparsity. Dots show the numerical solution (note some numerical instability at low and γ), full curves are the best fits.

