. 2021 Jul 29;10:e66135. doi: 10.7554/eLife.66135

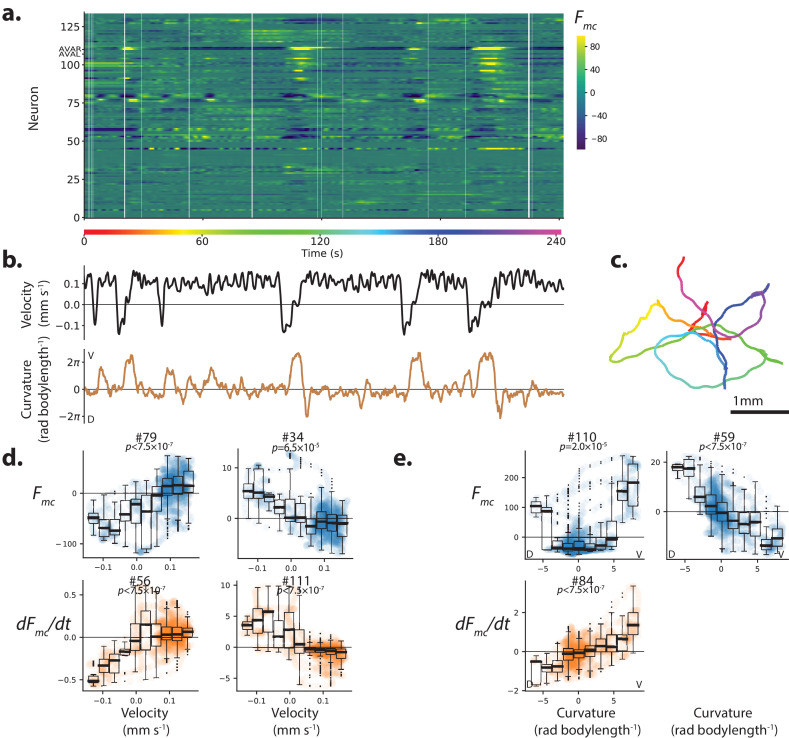
Figure 1. Population calcium activity and tuning of select neurons during spontaneous animal movement.

Recording AML310_A. (a) Calcium activity of 134 neurons is simultaneously recorded during locomotion. Activity is displayed as motion-corrected fluorescent intensity Fmc. Neurons are numbered according to agglomerative hierarchical clustering. White space indicates time-points where neural tracking failed. (b) Body bend velocity and body curvature derived from an eigenvalue decomposition, and (c) position on the plate during recording are shown. (d) Example neurons significantly tuned to velocity. Examples are those with the highest Pearson’s correlation coefficient in each category: activity (or its derivative) with positive (or negative) correlation to velocity. P-values are derived from a shuffling procedure that preserves per-neuron correlation structure. All tuning curves shown are significant at 0.05% after Bonferroni correction for multiple hypothesis testing (p<1.9×10⁻⁴). Boxplot shows median and interquartile range. Blue or orange shaded circles show neural activity at each time point during behavior. (e) Example neurons highly tuned to curvature were selected similarly. No neurons with negative dF/dt tuning to curvature passed our significance threshold.

Figure 1.

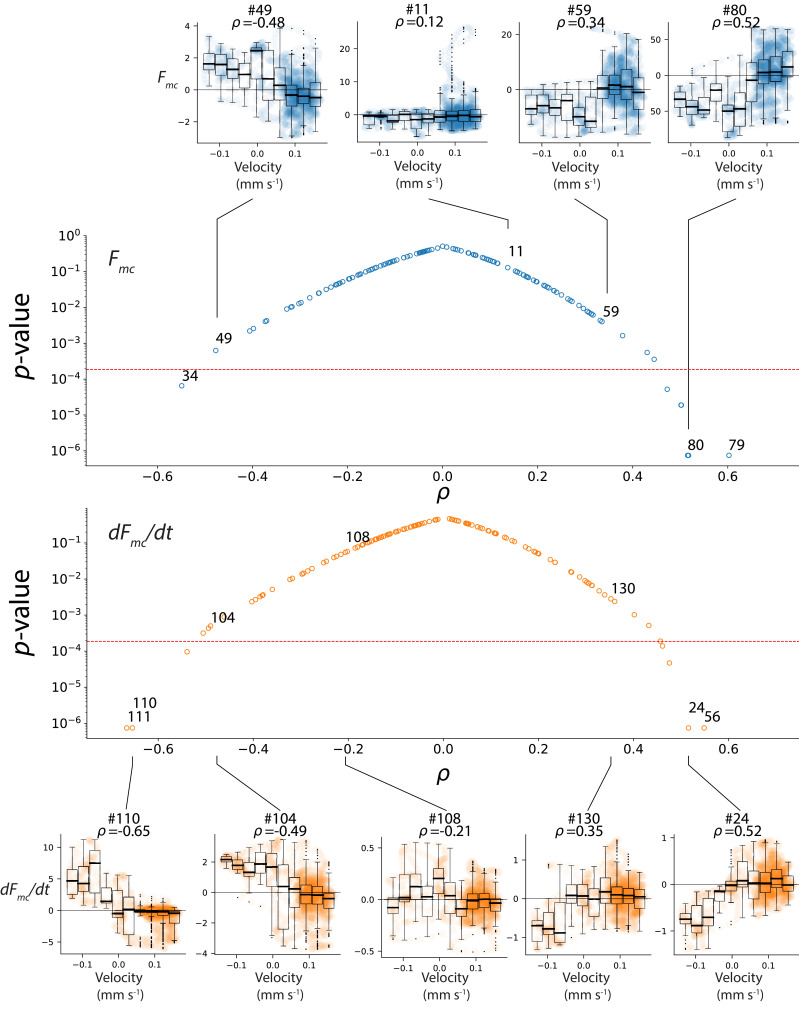
Figure 1—figure supplement 1. Additional details and examples of velocity tuning.

Figure 1—figure supplement 1.

Additional examples of velocity tuning curves for Fmc (top) and dFmc/dt (bottom) from recording AML310_A are shown. The correlation coefficient ρ captures the relation between each neuron’s activity and curvature and is plotted with a corresponding p-value (middle). The p-value is calculated from a time-lag shuffle and tests the null hypothesis that such a correlation would be found due to chance. Dashed line indicates a significance level of 0.05 after a Bonferonni correction for multiple hypothesis testing (p<1.9×10⁻⁴).

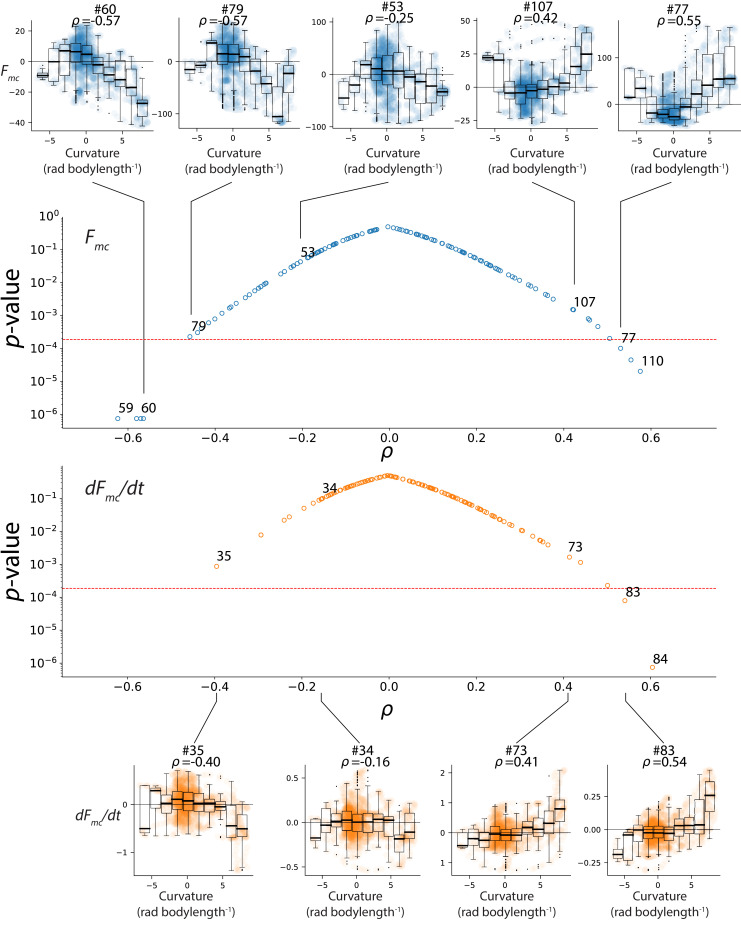
Figure 1—figure supplement 2. Additional details and examples of curvature tuning.

Figure 1—figure supplement 2.

Additional examples of curvature tuning for Fmc (top) and dFmc/dt (bottom) from recording AML310_A are shown. The correlation coefficient ρ captures the relation between each neuron’s activity and velocity and is plotted with a corresponding p-value (middle). The p-value is calculated from a time-lag shuffle and tests the null hypothesis that such a correlation would be found due to chance. Dashed line indicates a significance level of 0.05 after a Bonferonni correction for multiple hypothesis test (p<1.9×10⁻⁴).

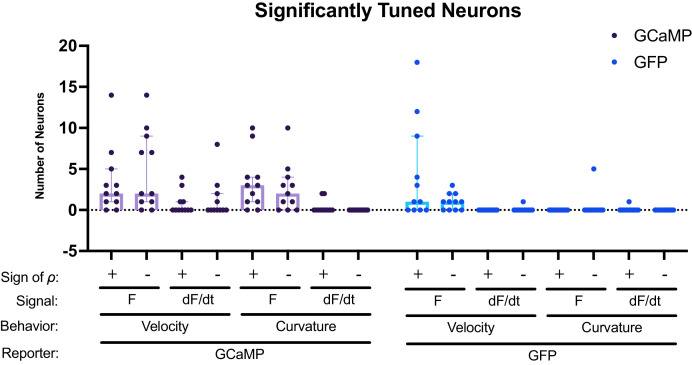
Figure 1—figure supplement 3. Number of significantly tuned neurons across recordings.

Figure 1—figure supplement 3.

Pearson’s correlation coefficient ρ was calculated for each neuron in 11 GCaMP recordings and 11 GFP control recordings that lacked a calcium indicator. Neurons were counted as significantly tuned if their Pearson’s correlation coefficient passed a recording-specific multiple-hypothesis corrected significance test and exceeded an absolute value of 0.4. Bar shows median. Whiskers show inter-quartile range.