. 2021 Jul 29;10:e66135. doi: 10.7554/eLife.66135

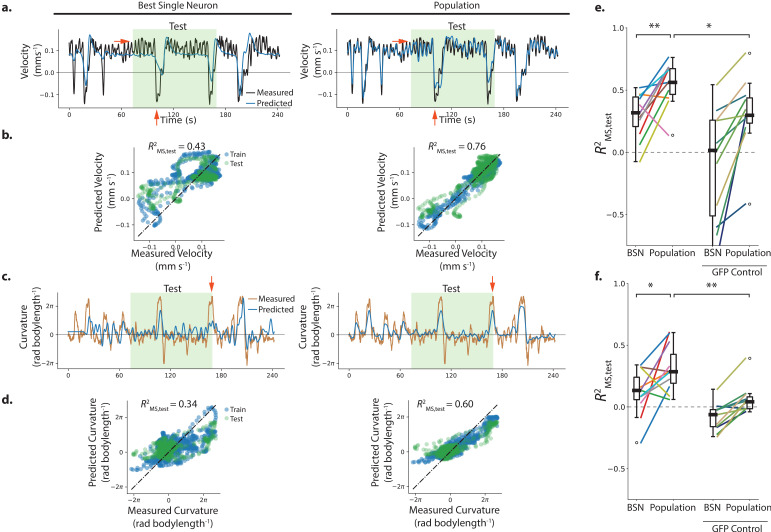
Figure 3. Population neural activity decodes locomotion.

(a–d) Performance of the best single neuron (BSN) is compared to a linear population model in decoding velocity and body curvature for the exemplar recording AML310_A shown in Figure 1. (a) Predictions on the held-out test set are compared to measured velocity. Light green shaded region indicates held-out test set. Red arrows indicate examples of features that the population captures better than the BSN. (b) Performance is reported as a coefficient of determination RMS2 evaluated on the mean-subtracted held-out test data (green points). (c,d) Model predictions are compared to measured curvature. (e) Performance of velocity decoding is shown for recordings of n=11 individuals (strain AML310 and AML32) and for recordings of n=11 GFP control animals lacking a calcium indicator (strain AML18). Two-sided Wilcoxon rank test is used to test significance of population performance compared to BSN, p=3.9×10³. Welch’s unequal variance t-test is used to test significance of population performance compared to GFP control, p=3.2×10⁻². (f) Performance of curvature decoding is shown for all recordings. Each recording is colored the same as in e. p=3.2×10⁻² and p=1.8×10⁻³ for comparisons of population performance to that of BSN, and GFP control, respectively.

Figure 3.

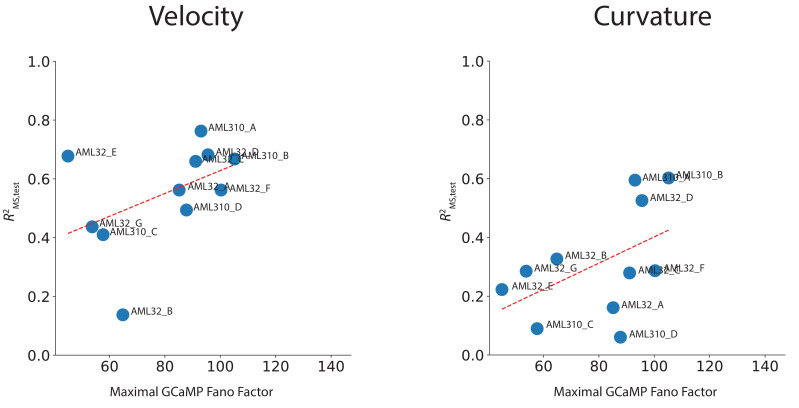
Figure 3—figure supplement 1. Performance correlates with maximal GCaMP Fano Factor, a metric of signal.

Figure 3—figure supplement 1.

Decoding performance is plotted against maximal GCaMP Fano Factor for each recording for velocity and curvature. Maximal GCaMP Fano Factor is the Fano Factor of the raw GCaMP activity for the neuron in each recording with the highest Fano Factor, maxi(σ2[Fi,GCaMP]μ[Fi,GCaMP]). Labels for each recording are shown. Dashed red line is the line of best fit (correlation coefficient between fit and data is ρ=0.46 for velocity and ρ=0.49 for curvature).
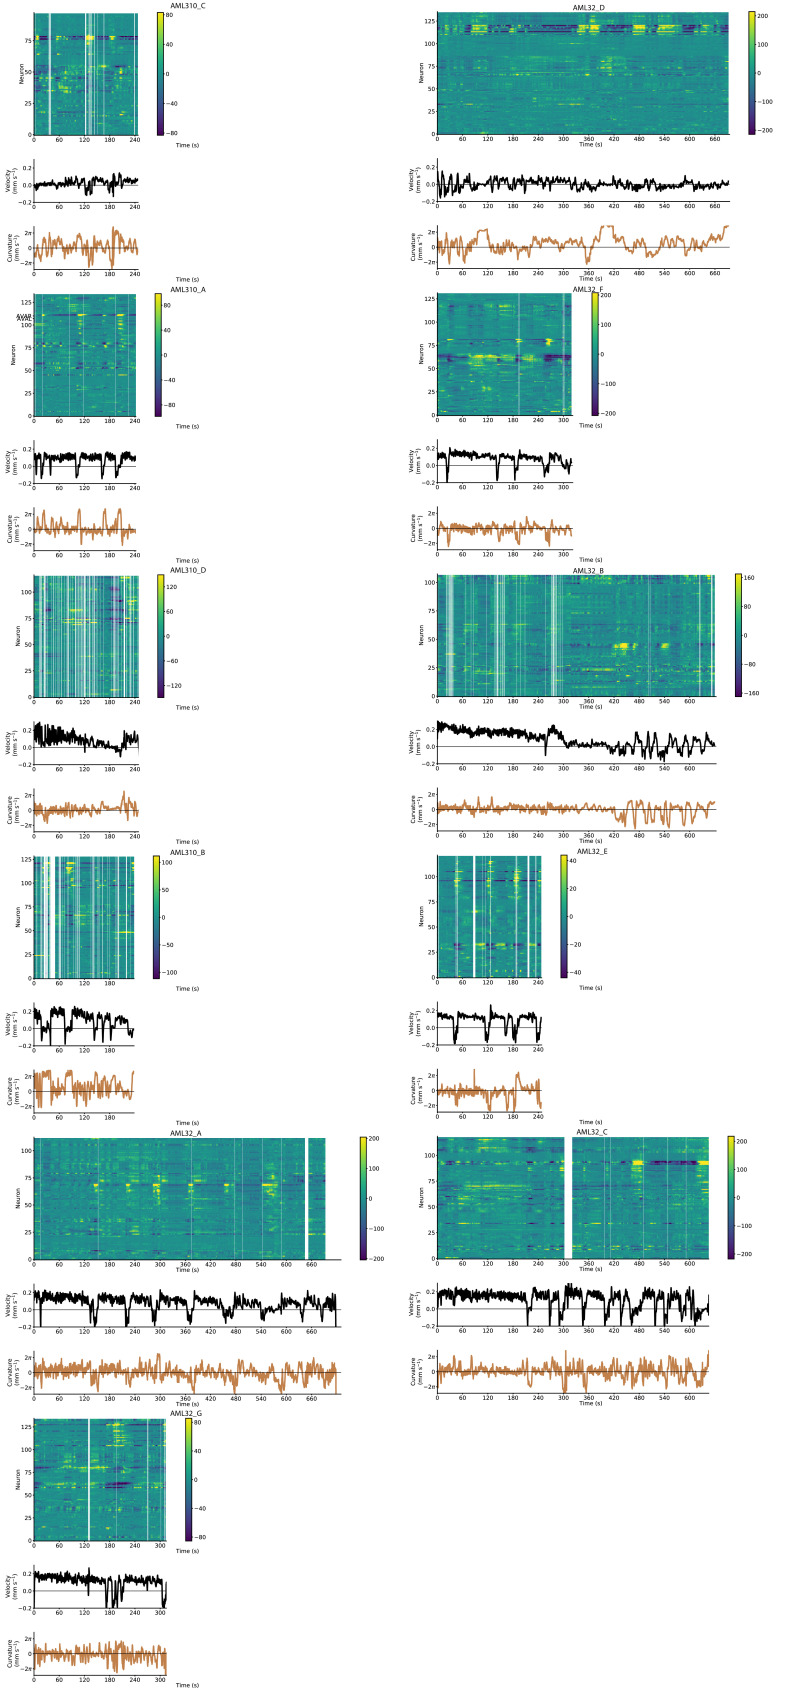
Figure 3—figure supplement 2. Neural activity and behavior for all moving calcium imaging recordings (AML310 and AML32).

Figure 3—figure supplement 2.

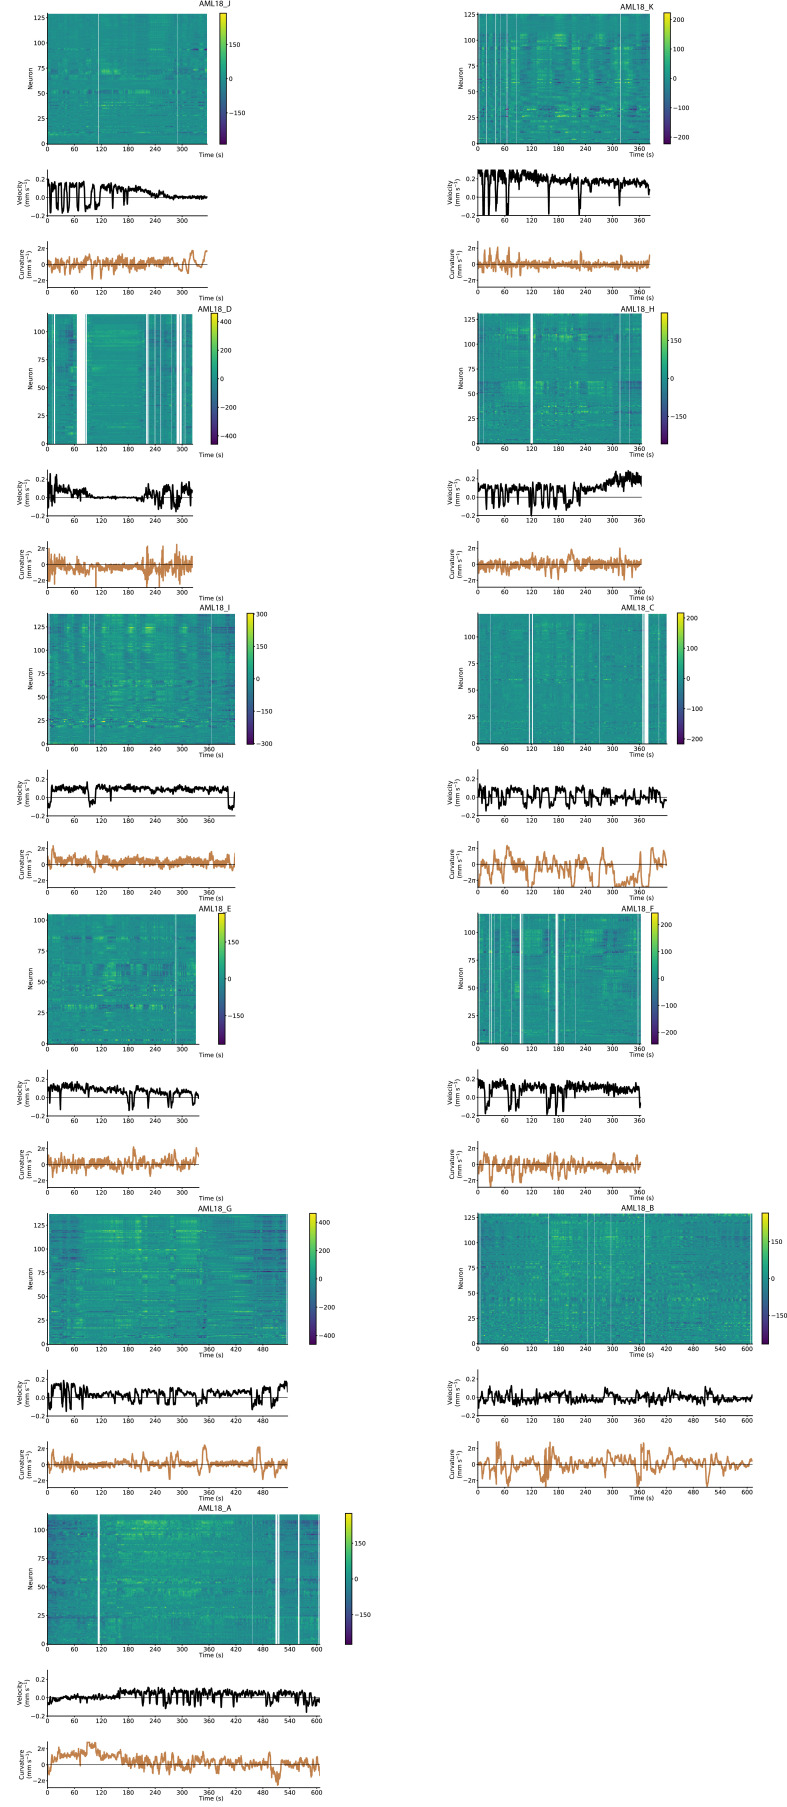
Figure 3—figure supplement 3. Neural activity and behavior for all moving GFP control recordings (AML18).

Figure 3—figure supplement 3.

Neural activity and behavior for all moving GFP control recordings (AML18).
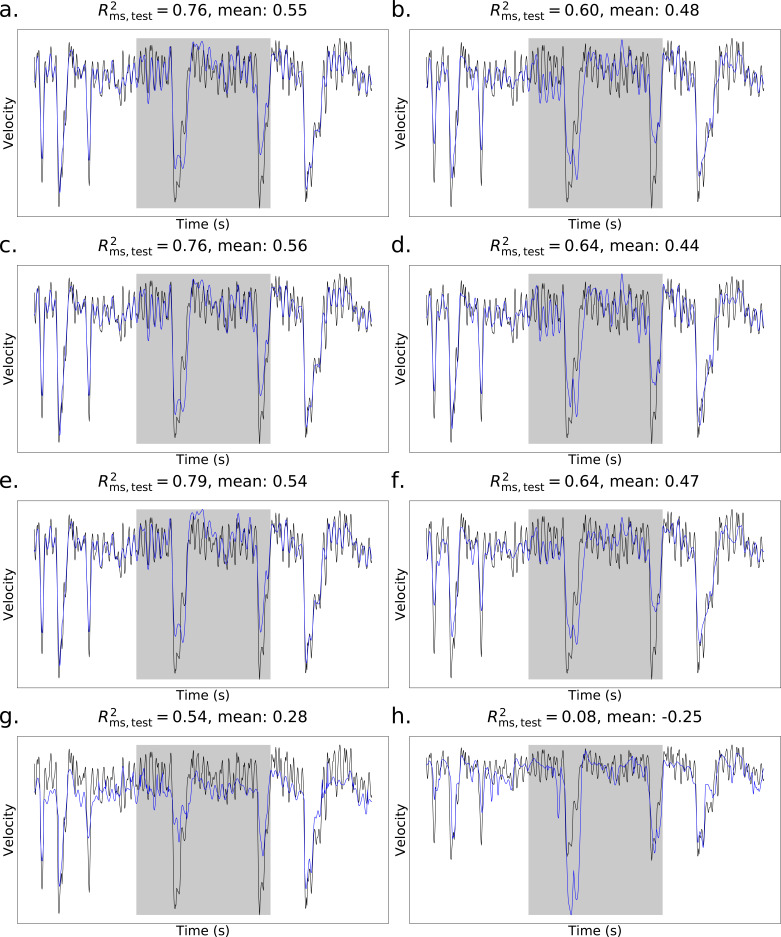
Figure 3—figure supplement 4. Alternative population models.

Figure 3—figure supplement 4.

Performance of alternative population models for decoding velocity. Traces are shown for exemplar recording AML310_A. Mean across all moving GCaMP recordings is also listed. Gray shading shows held-out test set. (a) The population model used throughout the paper. This model uses ridge regression with fluorescence signals and their temporal derivatives as features. (b) A linear model using ridge regression, with only fluorescence (not temporal derivative) signals as features. (c) A linear model using fluorescence signals and their temporal derivatives as features, regularized with a combination of a ridge penalty and the squared error of the temporal derivative of behavior. (d) The model in c, but using only fluorescence signals as features. (e) A linear model using fluorescence signals and their temporal derivatives as features, regularized with an ElasticNet penalty with an L1 ratio of 10-2. (f) The model in e, but using only fluorescence signals as features. (g) The multivariate adaptive regression splines (MARS) model, using fluorescence signals and their temporal derivatives as features. (h) A linear model together with a shallow decision tree, using fluorescence signals and their temporal derivative as features.
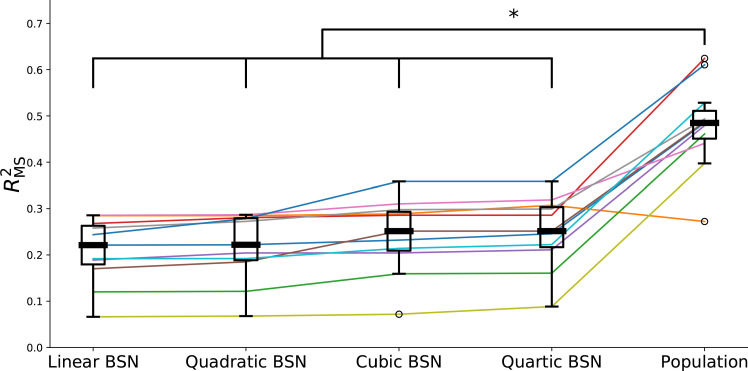
Figure 3—figure supplement 5. Nonlinear fits using best single neuron.

Figure 3—figure supplement 5.

Performance of polynomial regression models for decoding velocity on 11 GCaMP recordings using the best single neuron. The best single neuron is defined as the one with the best decoding performance using a linear model on the training data. We compare the performance of these regression models to that of the population model using a two-sided Wilcoxon rank test. The population model significantly (p < 0.05) outperforms polynomial regression models up to fourth order.