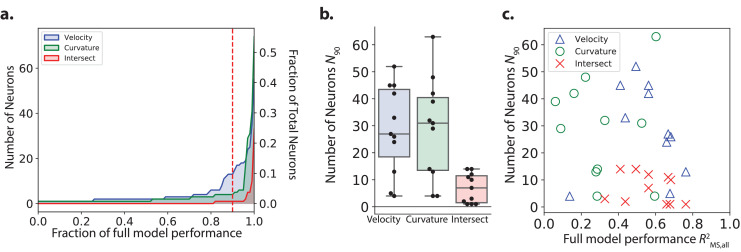
Figure 6. Number of neurons needed by the model to decode velocity and curvature.
(a) The minimum number of neurons needed for a restricted model to first achieve a given performance is plotted from recording AML310_A in Figure 1. Performance, is reported separately for velocity (blue) and curvature (green) and is calculated on the entire recording (test and train). Intersect refers to the intersection of the set of neurons included in both partial models (velocity and curvature) for a given performance. Red dashed line, N90, indicates number of neurons needed to achieve 90% of full model performance. (b) N90 is computed for velocity and curvature for all recordings. The number of neurons present in both populations at 90% performance level (intersection) is shown. Box shows median and interquartile range. (c) N90 for all recordings is shown plotted versus the performance of the full population velocity or curvature decoder, respectively. Number of intersection neurons (red ’x’) is plotted at the higher of either the velocitys or curvature’s performance.

