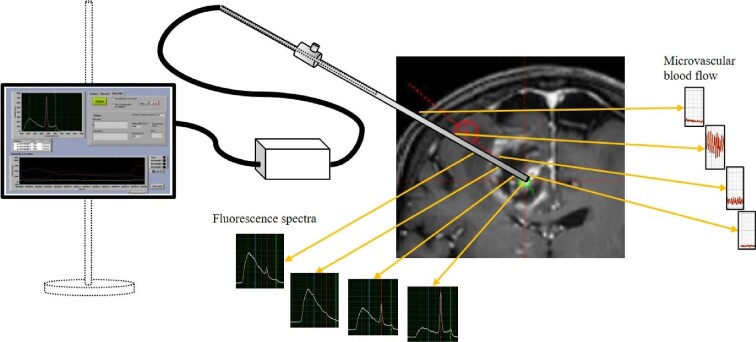
FIGURE 1.
Schematic setup of a measurement procedure. The microvascular blood flow was measured along the trajectory (right) from the cortical insertion to the target point inside the tumor. The fluorescence signals increase from the marginal zone (left) to the contrast enhancing parts of the tumor, and they are low in the necrotic parts.

