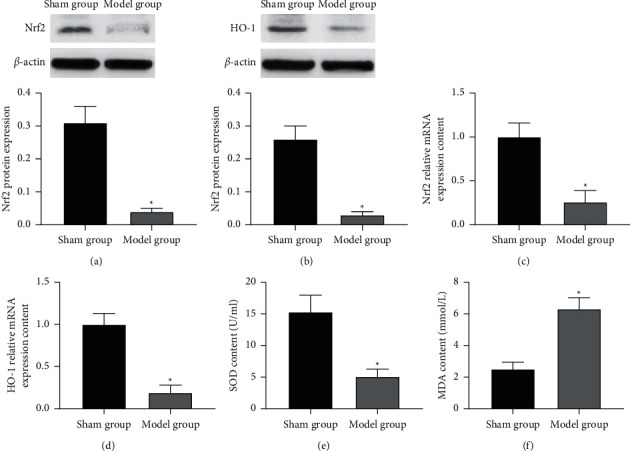
Figure 2.

The expression of Nrf2 and HO-1 and the level of oxidative stress in the brain tissue of experimental cerebral infarction rats. Note. (a)-(b) Nrf2 and HO-1 protein expression; (c)-(d) Nrf2 and HO-1 mRNA expression; (e)-(f) oxidative stress level; compared with the sham group, ∗p < 0.05.
