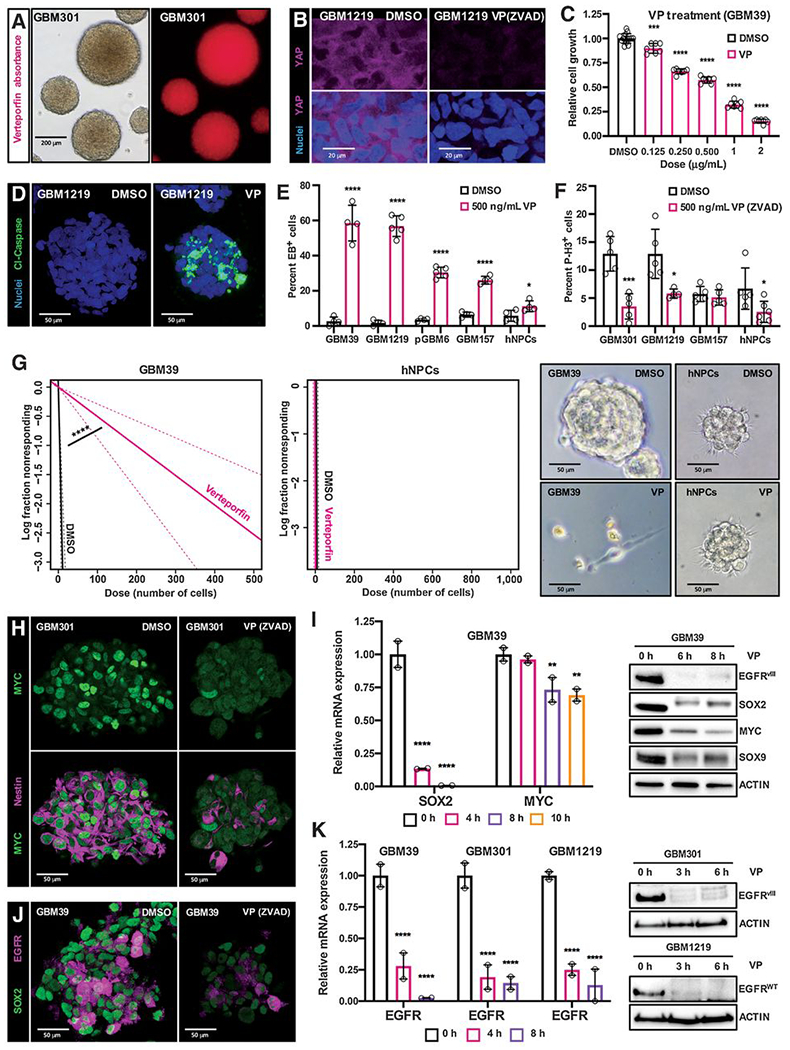
Figure 3. Pharmacologic inhibition of YAP/TAZ transcription with verteporfin specifically inhibits stem cell identity and induces apoptosis and growth arrest in GBM gliomasphere cultures.

(A) Verteporfin (VP) absorption in GSC cultures in vitro, as detected via fluorescence. Cells were incubated with .5 μg/mL (.69 μmol/L) verteporfin for 12 hours.
(B) YAP protein levels and nuclear localization in YAP/TAZ-positive EGFR-mutant GSCs (GBM1219); GSCs were treated with either DMSO or .5 μg/mL verteporfin and ZVAD (20 μmol/L, to prevent apoptosis and preserve signaling pathways) for 24 hours. YAP visualized by immunofluorescence. 3 μm optical projections.
(C) WST-1 assay on EGFR-mutant GSCs (GBM39) to examine their viability and growth when treated with variable doses of verteporfin for 48 hours.
(D-F) Verteporfin toxicity in YAP/TAZ-positive EGFR-mutant GSCs compared to control cells. (D) Representative GBM1219 GSCs were treated with .5 μg/mL of verteporfin for 24 hours and Cleaved-Caspase-3 (Cl-Caspase-3) was visualized by immunofluorescence to examine apoptosis, 22 μm optical projections. (E, F) YAP/TAZ positive EGFR-mutant GSCs (GBM39, GBM1219), YAP/TAZ-negative GSCs (pGBM6), EGFR-negative PN GSCs (GBM157), and hNPCs were treated with .5 μg/mL of verteporfin for 24 hours. (E) Apoptosis visualized by ethidium bromide (EB) dye exclusion assays and (F) proliferation visualized by phospho-Histone-H3 (P-H3) immunofluorescence on cells treated with 20 μmol/L zVAD to prevent apoptosis, both quantified in 25 μm confocal z-stacks.
(G) Limiting dilution assays in which EGFR-mutant GSCs (GBM39) and hNPCs were plated at low density of 1-1000 cells per well in 96 well plates, incubated with 1 μg/mL verteporfin, and observed for neurosphere formation after 7 days.
(H-K) Tumor stem cell marker mRNA and protein levels in the indicated GSCs treated with verteporfin or DMSO as a control, as measured by qPCR, immunoblot, and immunofluorescence. 3 μm optical projections. Cells were treated with .5 μg/mL verteporfin for 24 hours for immunofluorescence and 1 μg/mL verteporfin for indicated timepoints in qPCR and immunoblots. ZVAD (20 μmol/L) was used to prevent apoptosis. Graphs show representative qPCR experiments, and error bars show range between experimental replicates.
*p≤.05; **p≤.01; ***p≤.001; ****p≤.0001 with unpaired t tests. Symbols for each bar indicate replicates per condition.
