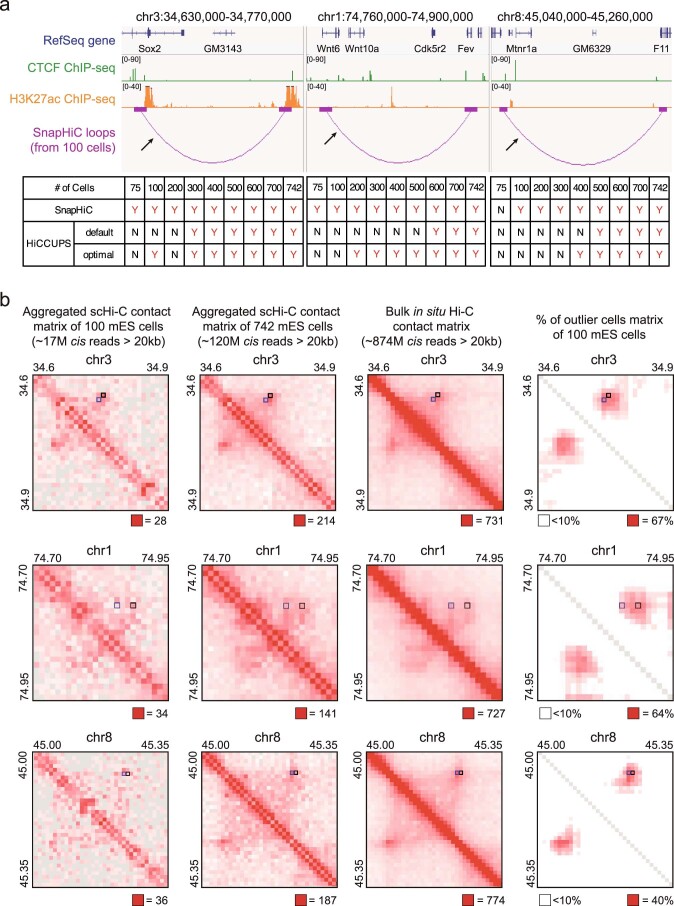
Extended Data Fig. 4. Performance of SnapHiC and HiCCUPS at Sox2, Wnt6 and Mtnr1a loci.
a, (Top) Chromatin loops around Sox2 (left), Wnt6 (middle), and Mtnr1a (right) gene identified from 100 mES cells using SnapHiC at 10 kb resolution. The black arrow points to the interactions verified in the previous publications13,14 with CRISPR/Cas9 deletion or 3C-qPCR. (Bottom) Comparison of the performance of SnapHiC and HiCCUPS (applied on aggregated scHi-C data with default or optimal parameters) from different number of mES cells at these three regions. If the previously verified interaction (black arrow) is recaptured, it is labeled as ‘Y’; otherwise, it is labeled as ‘N’. b, From left to right: aggregated scHi-C contact matrix of 100 mES cells, aggregated scHi-C contact matrix of 742 mES cells, bulk in situ Hi-C contact matrix from mES cells (replicate 1 from Bonev et al. study8) and % of outlier cells matrix of 100 mES cells at 10 kb resolution; from top to bottom: Sox2 locus, Wnt6 locus, and Mtnr1a locus. Black squares represent the SnapHiC-identified loops from 100 mES cells, which are shown in (a) as purple arcs. For comparison, the HiCCUPS-identified loops from the deepest available bulk in situ Hi-C data of mES cells (combining all four replicates from Bonev et al. study8) are marked as blue squares.

