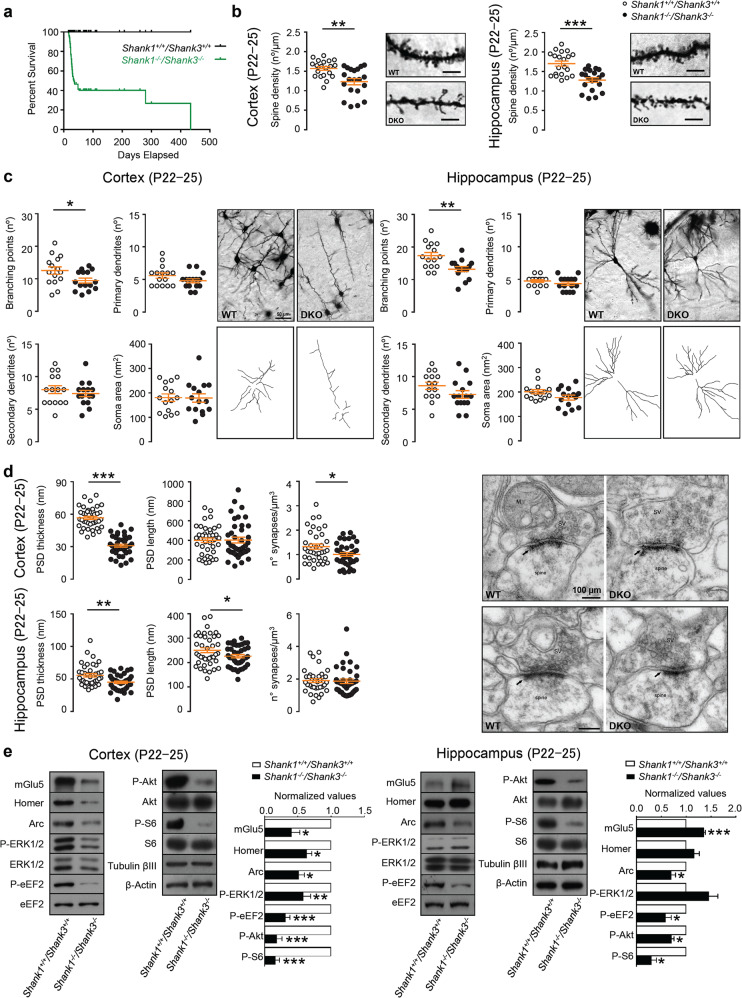
Fig. 1. Shank1 and Shank3 double mutation causes severe deficits in young (P22–25) mice.
a Survival curve of the WT and Shank1−/− Shank3−/− DKO mice shows that more than 60% of DKO mice die around postnatal day (P) P22–P25. Comparison of survival curve was made by Log-rank (Mantel-Cox) test; n = 101 animals for each group; ****p < 0.0001. b Representative images and quantification of the spine density in cortical (left panel) and hippocampal neurons (right panel) from P22–25 wild-type and Shank1−/−Shank3−/− DKO mice (Golgi–Cox staining, scale bar: 5 µm). Two-tailed Mann–Whitney test was used for statistical analysis; n = 3 for each group; **p < 0.01; ***p < 0.001. c Quantification of the number of branching points, primary, and secondary dendrites and soma area both in cortex and in hippocampus of Shank1−/− Shank3−/− DKO mice (50 µm). Somatosensory cortex: branching points, secondary dendrites, and soma area were analyzed by unpaired, two-tailed student’s t-test; primary dendrites were analyzed by Two-tailed Mann–Whitney test. Hippocampus CA1 and CA3: secondary dendrites and branching points were analyzed by unpaired, two-tailed student’s t-test; primary dendrites and soma area were analyzed by Two-tailed Mann–Whitney test. Sample size n = 3 for each group; *p < 0.5; **p < 0.01. d Analysis of PSD length, thickness, and number of synapses in cortical (top panels) and hippocampal (bottom panels) neurons from P22–25 of Shank1+/+ Shank3+/+ wild-type (WT) and Shank1−/− Shank3−/− DKO mice. Representative electron microscopy images of cortical and hippocampal synapses from P22–25 wild-type and Shank1−/−Shank3−/− DKO mice (right panels) (100 µm). Somatosensory cortex: PSD thickness and number of synapses were analyzed by unpaired, two-tailed student’s t-test; PSD length was analyzed using two-tailed Mann–Whitney test. Hippocampus CA1: PSD thickness and number of synapses were analyzed by unpaired, two-tailed student’s t-test; PSD length was analyzed using unpaired, two-tailed student’s t-test with Welch’s correction. Analyses are based on a sample size of n = 2 animals for each group (WT and DKO); *p < 0.05; **p < 0.01; ***p < 0.001. e Representative western blots and relative protein quantifications from cortical (left) and hippocampal (right) PSD-enriched fractions derived from P22–-25 wild-type and Shank1−/− Shank3−/− DKO mice. Protein expression was normalized to wild-type levels and plotted as relative change of expression levels. Phosphoprotein levels were normalized against total protein levels. Data were analyzed by one sample t-test; Cortex: mGlu5, Arc n = 9 for each group; Homer1b/c, P-S6 n = 12 for each group; P-ERK1/2 n = 15 for each group; P-eEF2 N = 24 for each group; P-AKT n = 21 for each group. Hippocampus: mGlu5 n = 15 for each group; Homer1b/c, P-ERK1/2, P-AKT, P-S6 n = 9 for each group; Arc, P-eEF2 n = 12 for each group. *p < 0.05; **p < 0.01; ***p < 0.001.

