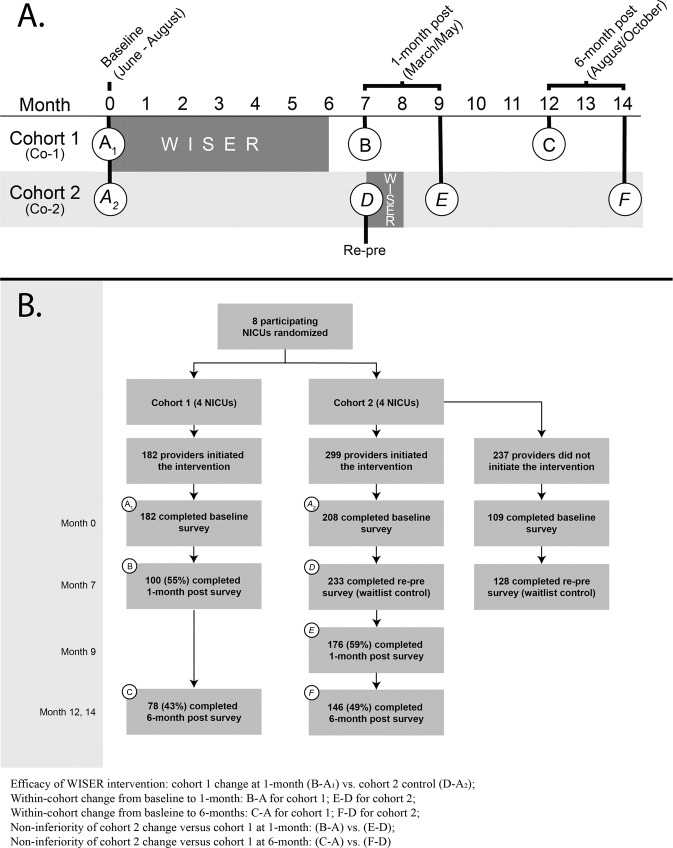
Fig. 1.
A Schematic of WISER study design. Active WISER period shaded gray. Seven assessment points presented in circles: two baseline assessment (A1 and A2), two 1-month follow-ups (B and E), two 6-month follow-ups (C and F), and one re-pre (D) that was a second baseline assessment for Cohort 2 for comparison with a 1-month post of Cohort 1. B CONSORT Diagram. Efficacy of WISER intervention: cohort 1 change at 1-month (B–A1) vs. cohort 2 control (D–A2). Within-cohort change from baseline to 1-month: B–A for cohort 1; E–D for cohort 2; Within-cohort change from baseline to 6-months: C–A for cohort 1; F–D for cohort 2; Effectiveness comparison of cohort 2 change versus cohort 1 at 1-months: (B–A) vs. (E–D); Effectiveness comparison of cohort 2 change versus cohort 1 at 6-month: (C–A) vs. (F–D).

