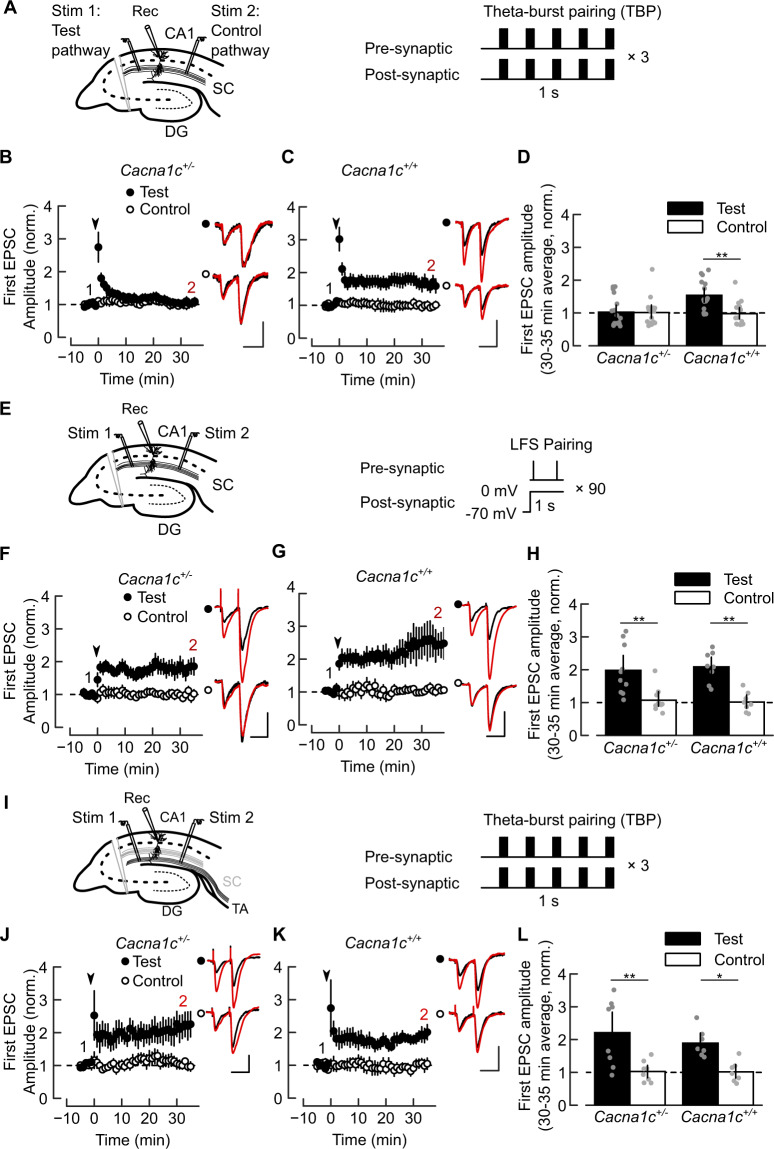
Fig. 2. Reduced Cacna1c dosage impairs LTCC-sensitive induction of associative LTP selectively at Schaffer collateral to CA1 (SC-CA1) synapses.
A Electrodes placements (left) and theta-burst pairing (TBP) protocol (right) for LTP at SC-CA1 synapses. B No TBP-induced LTP at SC-CA1 synapses in Cacna1c+/− slices. C TBP-induced robust homosynaptic LTP at SC-CA1 in Cacna1c+/+ slices. D Summary of normalized change in EPSC amplitude at 30–35 min shown in (B) and (C). Effect of genotype on LTP: LR(1) = 5.16, p = 0.023; genotype × pathway interaction: LR(1) = 7, p = 0.0081. Pairwise comparisons of Test vs Control pathway for Cacna1c+/−: p = 0.99, n = 17 (12: 4 females and 8 males); Cacna1c+/+: p = 0.0057, n = 16(9). E Electrodes placements (left) and low-frequency stimulation (LFS-pairing) protocol (right) for SC-CA1 LTP. LFS-pairing induces SC-CA1 LTP in Cacna1c+/− (F) and Cacna1c+/+ slices (G). H Summary of EPSC amplitude change at 30–35 min shown in (F) and (G): no effect of genotype (LR(1) = 0.103, p = 0.748) or genotype × pathway interaction (LR(1) = 0.227, p = 0.633) on LTP. Pairwise Test vs Control for Cacna1c+/−: p = 0.0027, n = 10(7); Cacna1c+/+: p = 0.0011, n = 8(6). I Electrode placements (left) and TBP protocol (right) for LTP at TA-CA1 synapses. TBP induces homosynaptic TA-CA1 LTP in slices from Cacna1c+/− (J) and Cacna1c+/+ animals (K). L Summary of changes in normalized EPSC amplitude at 30–35 min shown in (F) and (G): no effect of genotype (LR(1) = 0.0258, p = 0.8724) and no genotype × pathway interaction (LR(1) = 0.065, p = 0.798); contrast Test versus Control pathways, in Cacna1c+/−: p = 0.0093, n = 8(7); Cacna1c+/+: p = 0.014, n = 7(5). Plots show EPSC amplitude time-course in Test and Control pathways, normalized to 5 min average before LTP induction (arrowheads). Insets: 5 min average EPSC waveforms before (1, black) and 30–35 min after (2, red) LTP induction; scale bars: 50 pA, 50 ms. Sample sizes given as cells(animals—all males unless indicated). Data presented as means ± SEM. *p < 0.05, **p < 0.01 determined by two-way ordinal regression (cumulative link model) followed by analysis of deviance (ANODE) (colour figure online).

