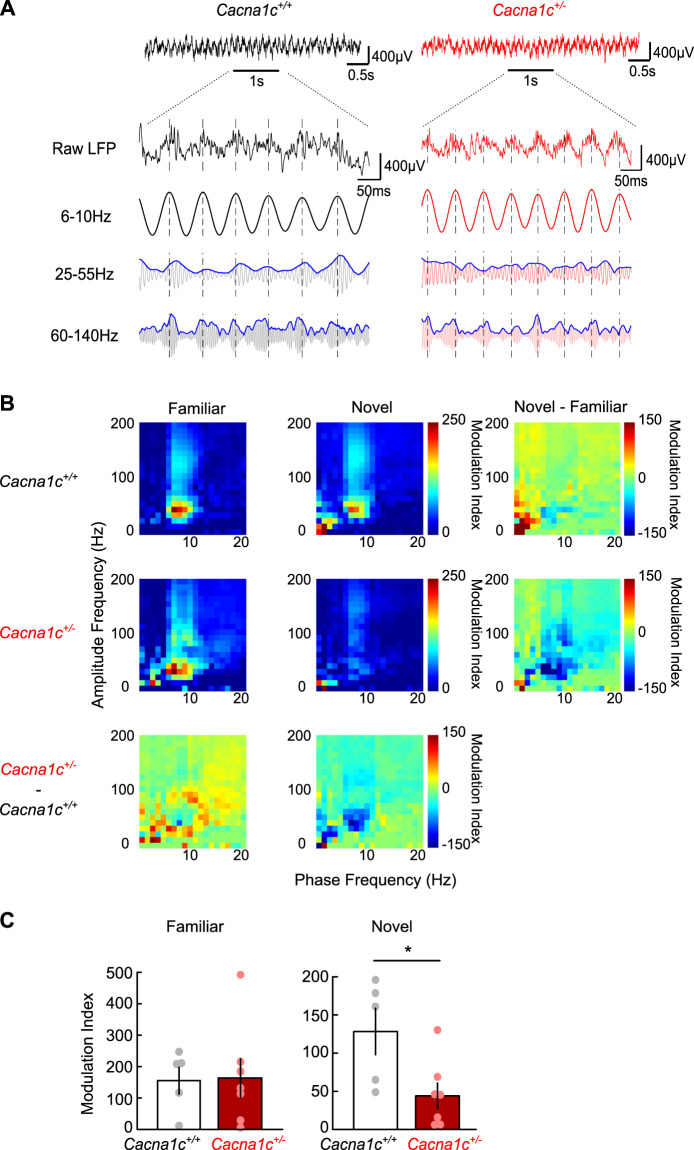
Fig. 4. Reduced theta-slow-gamma coupling in a novel environment in Cacna1c+/− rats.
A Local field potentials taken from runs on the familiar track. Top: Representative broadband LFP traces (0.1–475 Hz) taken from dorsal CA1 in a 5 s window while running. Bottom: 1 s expanded segment showing raw unfiltered LFP (top) and bandpass filtered theta (6–10 Hz), slow gamma (25–55 Hz) and fast gamma (60–140 Hz) (bottom). Phase-amplitude coupling measures the degree to which the amplitude envelope (blue traces shown for slow and fast gamma) is modulated by the phase signal (theta filtered LFP). Black: Cacna1c+/+; red: Cacnac1+/−; dashed vertical lines mark timings of theta cycle peaks. B Mean phase–amplitude coupling comodulograms taken from track runs on the familiar and novel track. Colour represents the modulation index (MI) depicting the degree of coupling between the phase of frequencies (1–20 Hz) on the x-axis and the amplitude of frequencies (1–200 Hz) on the y-axis. Differences between environments and genotypes are shown next to the mean plots as labelled (Cacna1c+/+: n = 5; Cacna1c+/−: n = 7). C Mean phase–amplitude coupling between theta (6–10 Hz) and slow gamma (25–55 Hz). Theta–slow gamma coupling was lower in Cacna1c+/− rats than Cacna1c+/+ rats on the novel track (p = 0.0256) but not on the familiar track (p = 0.9184). Cacna1c+/+: n = 5; Cacna1c+/−: n = 7; Data presented as means ± SEM. *p < 0.05, Student’s t test (colour figure online).

