
Fig. 6.
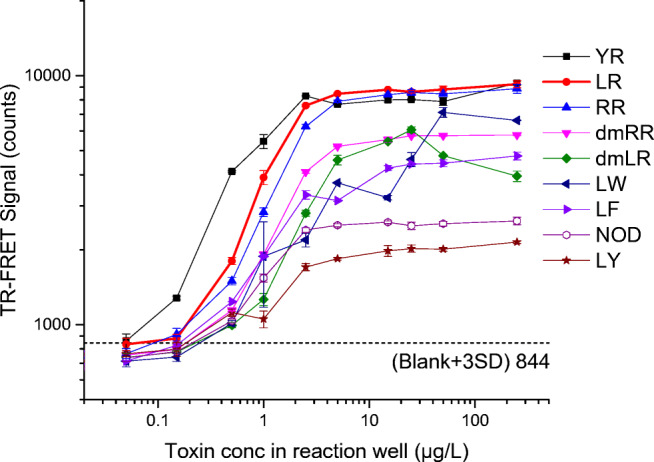
Standard curves of eight different microcystin variants and nodularin-R in the TR-FRET assay. Toxin concentrations in total 80-μL reaction well (0.05 to 250 μg/L) are plotted in logarithmic scale in X axis vs the corresponding TR-FRET signal (sensitized emission of AF680 at 730 nm) in logarithmic scale in Y axis. Standard deviations of duplicate measurements are shown as error bar. Error bars are not visible when interfering with symbols