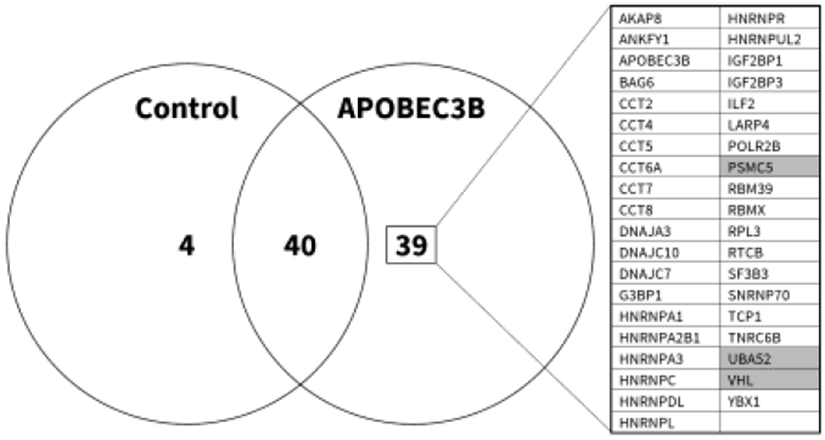
Figure 2. Proteomic analysis identifies A3B-pVHL interaction.

8 million 293T cells were cultured in 10 cm plates, and transfected on the following day with 10 μg of an HA-tagged A3B expression plasmid, or an empty control vector, in the presence of Epoxomicin. Lysates were subsequently incubated with HA- or IgG- conjugated agarose beads in order to affinity-purify A3B and identify non-specific protein-bead interactions, respectively. Proteins were denatured and separated on SDS-PAGE gels. Mass spectrometry analysis identified 39 interacting proteins, as shown, with shading indicating those that were related to ubiquitination and/or the proteasome.
