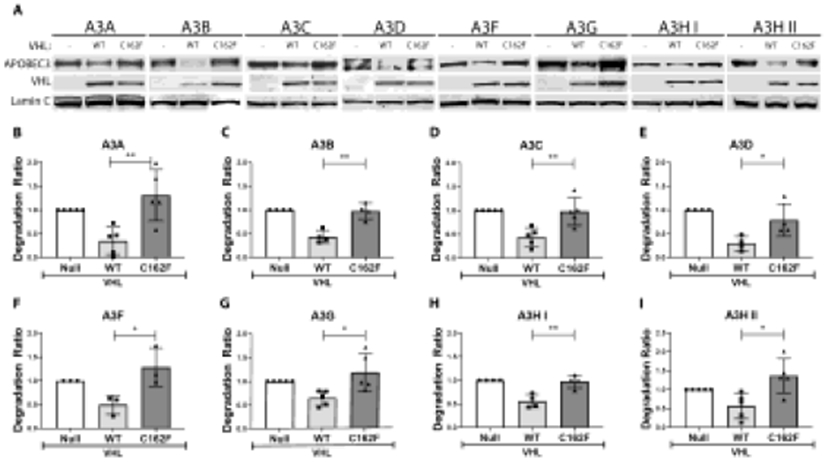
Figure 5. CRLpVHL formation is necessary for A3 degradation.

293T cells were cultured in 6-well plates of 800,000 cells per well, and transfected with various A3-expression constructs (500 ng) along with a plasmid expressing either no protein (empty vector or null control), WT pVHL, or C162F pVHL (1000 ng of each) the next day. (A) Representative western blots of each A3 protein expressed along with the null control, WT pVHL, and C162F pVHL are shown. (B-I) Quantification of the different A3 bands following multiple repeats of these experiments are shown. For all panels, values are means of a ratio (“A3 degradation ratio”) of A3 protein signal following the expression of each pVHL normalized to the null control with each point representing an independent replicate. Error bars are ± SD. Significance of difference between each degradation ratio, comparing change from A3 band quantitation in the null control following WT pVHL versus C162F pVHL expression, was analyzed by an unpaired t-test. Significant differences are indicated as either *P < 0.05 or **P < 0.01.
