Fig. 2.

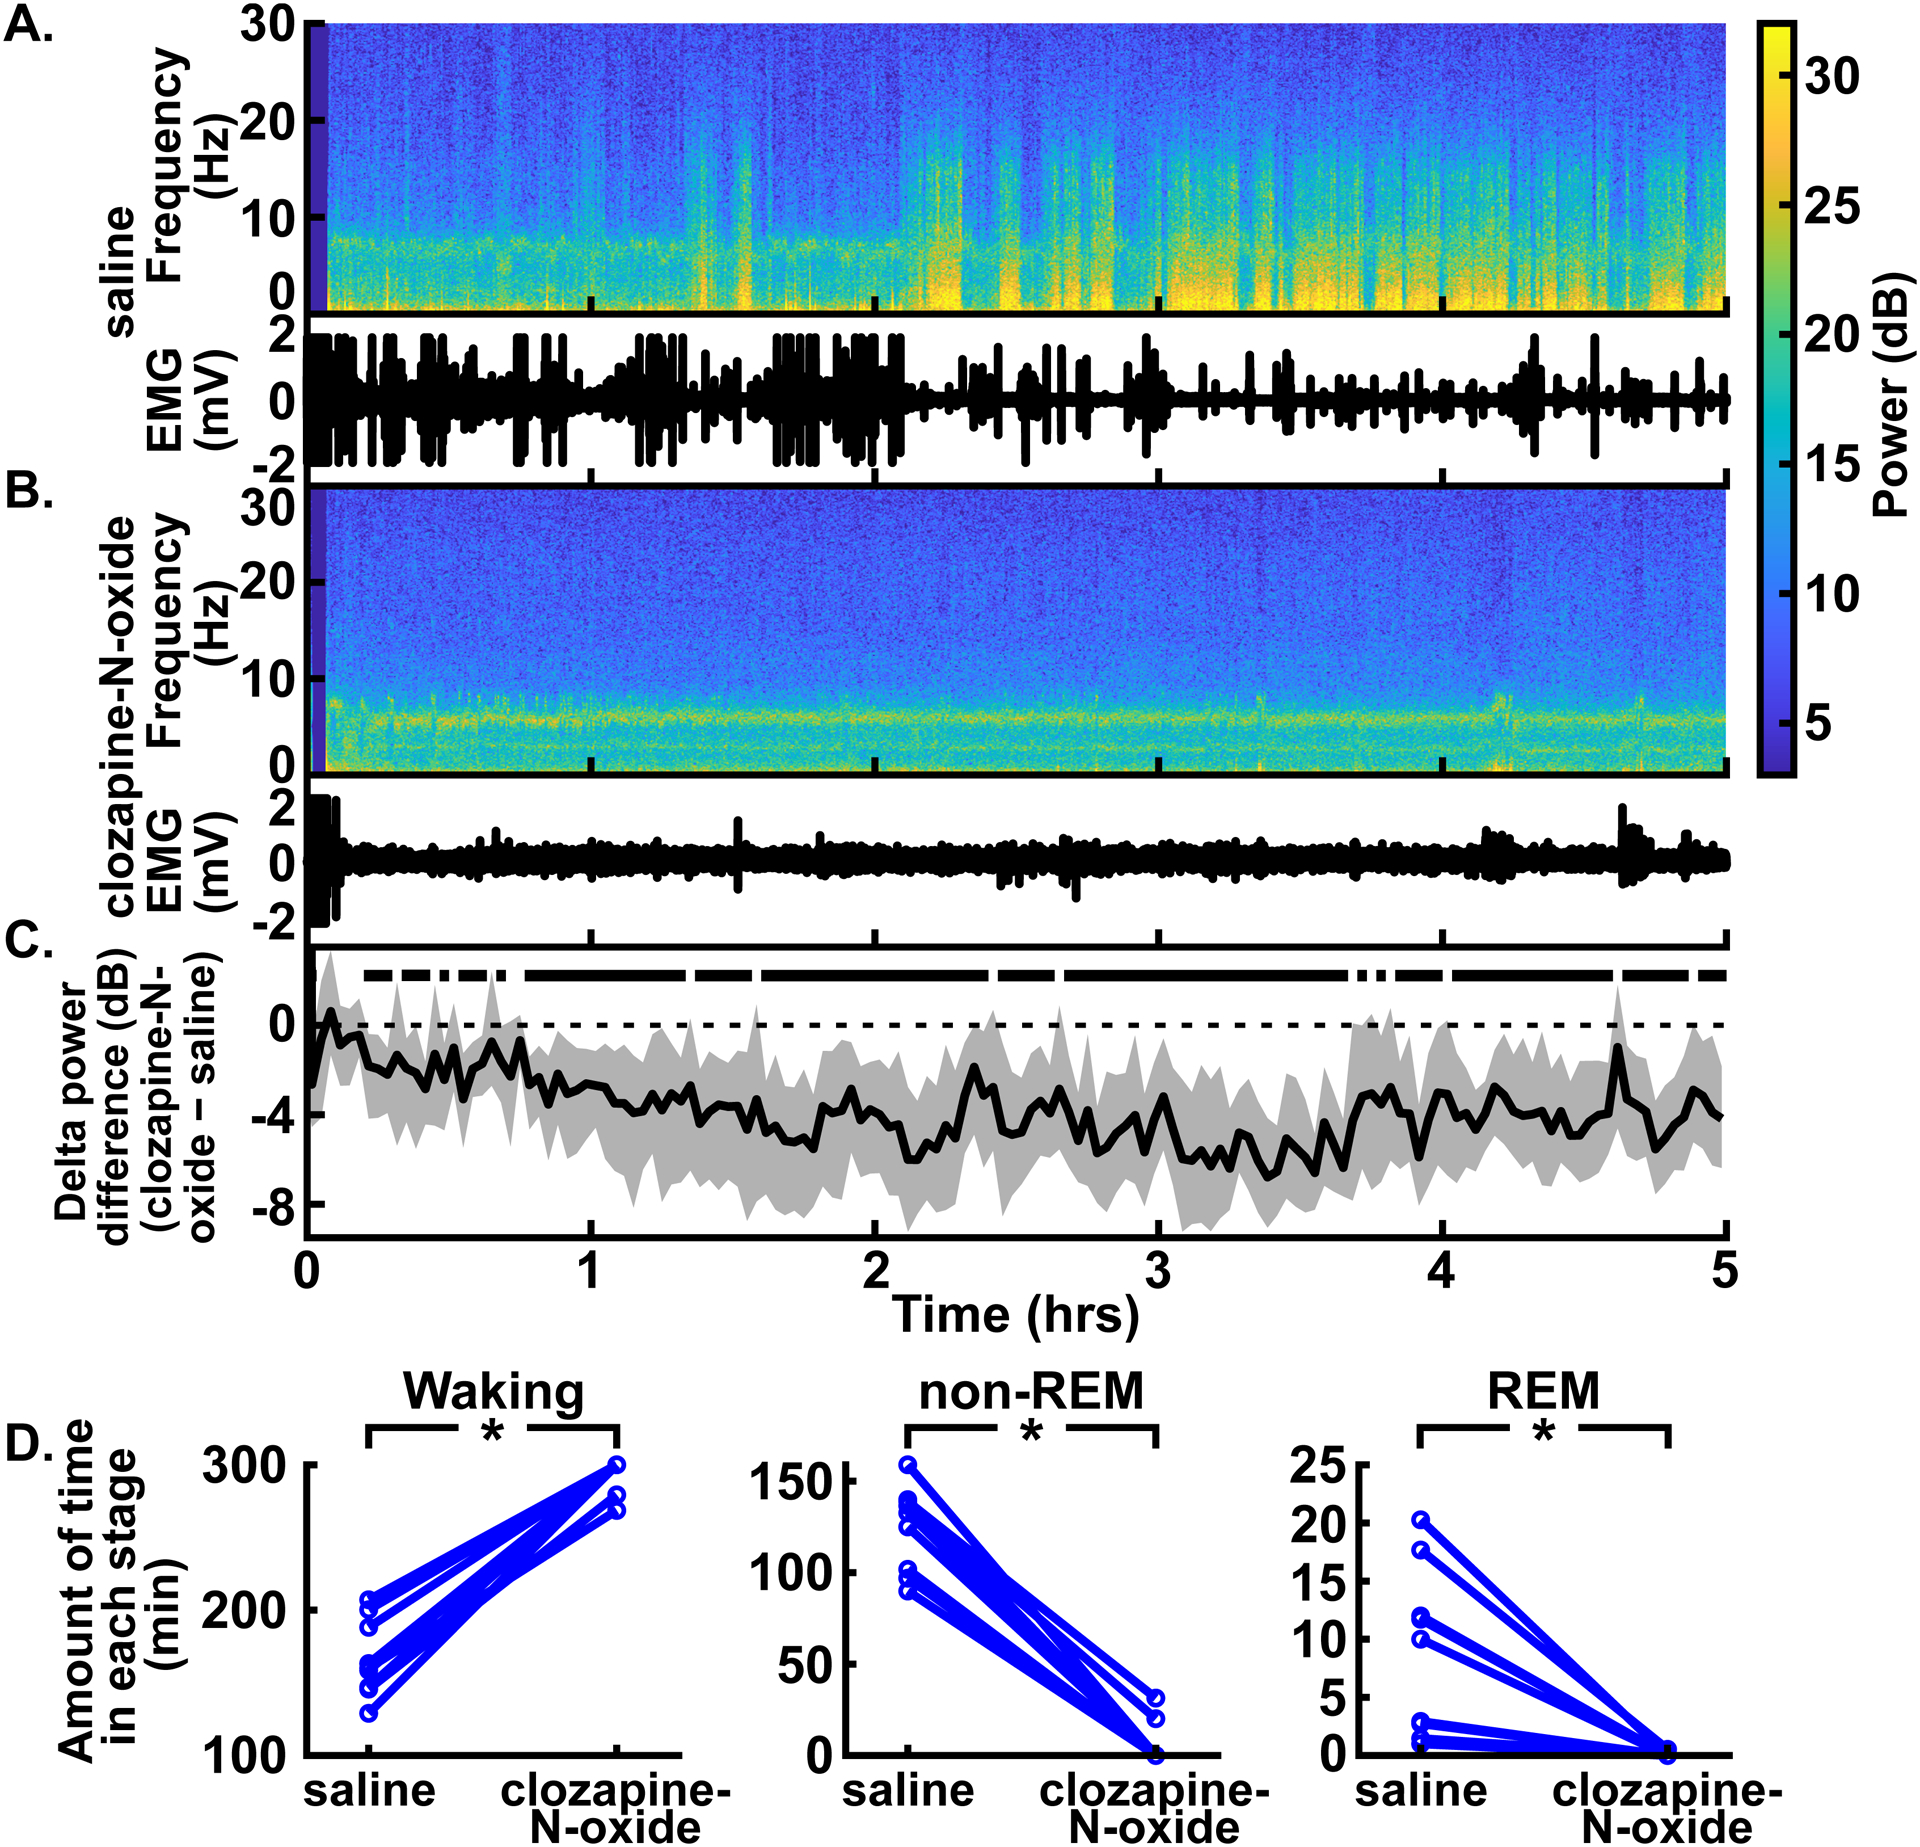
Excitation of CaMKIIa+ neurons in the parabrachial nucleus region decreased delta oscillations, non-REM, and REM sleep without anesthesia. (A) An example spectrogram shows the spectral power for 0–30 Hz over time in the prefrontal EEG following intraperitoneal injection of saline (top). The EMG from the same experiment shows lack of movement during times with high delta power (bottom) (B) An example spectrogram from the same rat following clozapine-N-oxide injection shows an absence of high delta power (top). The corresponding EMG shows stillness, possibly due to the clozapine-N-oxide injection (bottom; see Discussion). (C) Summary of power differences between conditions over time shows decreased mean delta power for clozapine-N-oxide experiments relative to saline experiments. For all power difference traces in this and subsequent figures, traces represent the median (± 99% CIs) of a bootstrapped collection of 5,000 mean differences. Thus, time points where the CIs (shaded regions) do not overlap with zero show statistically significant differences with 99% confidence. Time periods that show statistically significant differences with 99% confidence are indicated by black bars above the dashed zero line, representing lower power in the clozapine-N-oxide condition. Saline or clozapine-N-oxide injections were given at time = 0 hrs. (A), (B), and (C) have the same time axes. (D) Comparison of the amount of time spent in waking (left), non-REM (middle), and REM (right) stages between saline and clozapine-N-oxide conditions for the 5 hours following injection. Time spent in waking was longer and time spent in non-REM and REM sleep was shorter with clozapine-N-oxide experiments, relative to saline experiments, in a statistically significant way. *P < 0.05, two-sided Wilcoxon signed-rank test.
