Fig. 3.

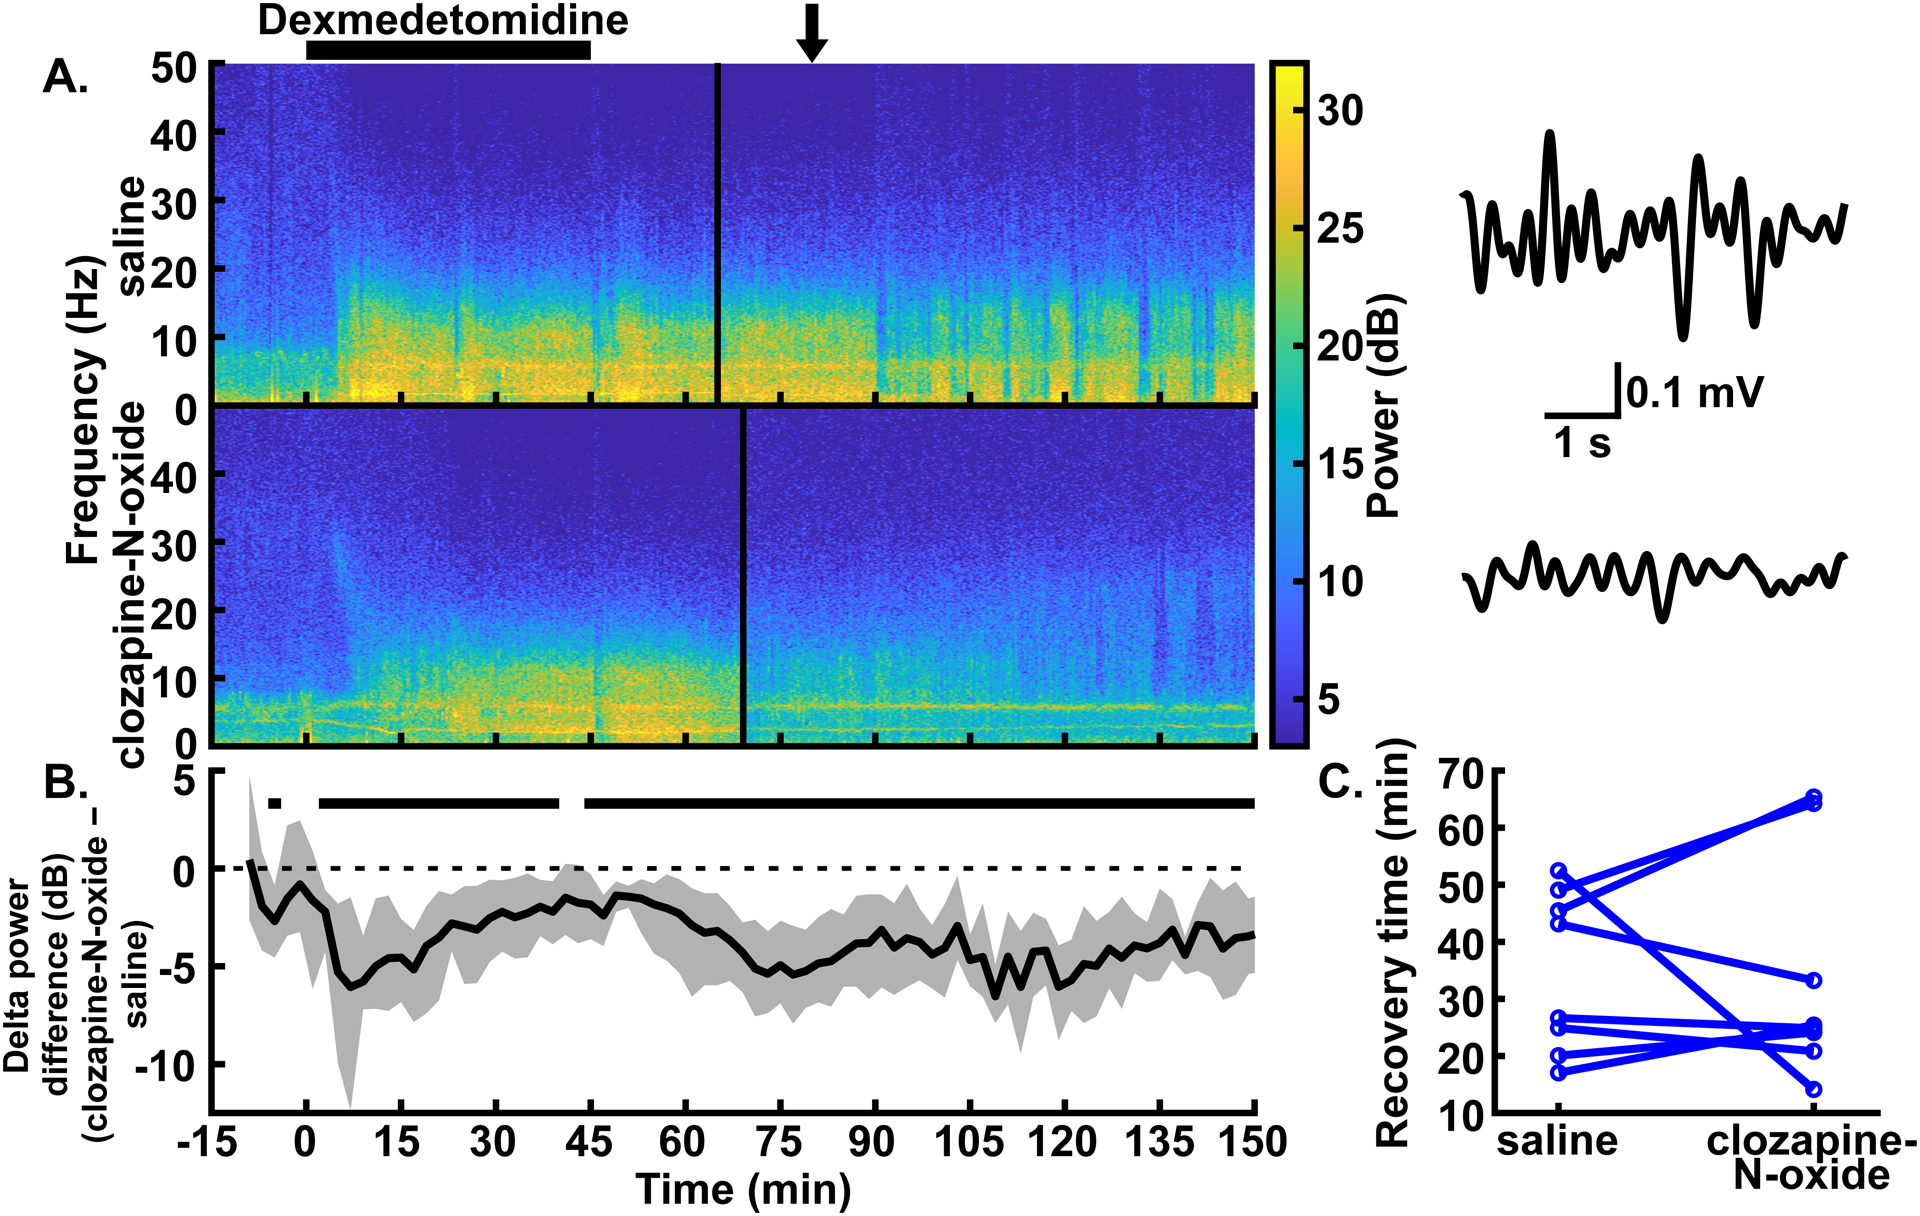
Excitation of CaMKIIa+ neurons in the parabrachial nucleus region decreased delta oscillations but did not affect recovery time with low-dose dexmedetomidine anesthesia. (A) Example spectrograms showing the spectral power for 0–50 Hz over time in the prefrontal EEG following intraperitoneal injections of saline (top) and clozapine-N-oxide (bottom) in the same rat. Black bar over the spectrograms indicates the time over which the dexmedetomidine infusion (0.3 μg∙kg−1∙min−1 for 45 mins) took place. Clozapine-N-oxide or saline injections were given an hour before the start of the dexmedetomidine infusion. Solid vertical lines represent the time of recovery for each example experiment. (Note: the transient dip in delta power at the end of dexmedetomidine administration in both [A] and [B] is due to our handling the rat to place it on its side.) Example EEG traces to the right of each spectrogram are bandpass filtered from 0.5–4 Hz and show the reduced delta amplitude with parabrachial nucleus region excitation. The arrow over the spectrograms indicates the time, for both conditions, from which the traces were taken. (B) Summary of power differences over time shows decreased mean delta power for clozapine-N-oxide experiments relative to saline experiments. Time periods that show statistically significant differences with 99% confidence are indicated by black bars above the dashed zero line, representing lower power in the clozapine-N-oxide condition. Spectrograms in (A) and summary power in (B) have the same time axes. (C) No statistically significant differences between conditions were seen in recovery times, as measured by time to return of righting reflex (or return of movement in cases where righting reflex was not lost).
