
FIGURE 3.
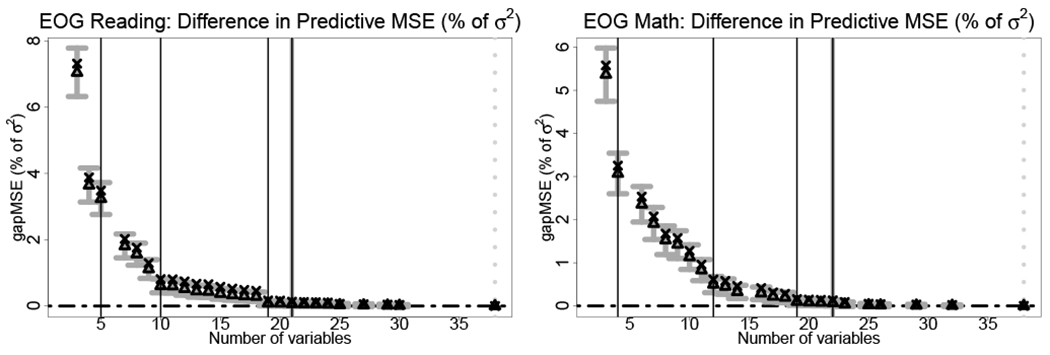
The difference in out-of-sample predictive MSEs between each model along the λ path and the best λmin model for EOG reading scores (left) and EOG math scores (right) as a percent of σ2. Expectations (triangles) and 95% intervals (gray bars) from the predictive distribution are included along with the out-of-sample MSEs (x-marks). The vertical black lines denote the ηmin(λ) values summarized in Table 2. The solid gray line denotes λ0,0.05 and the dotted gray line denotes λmin.