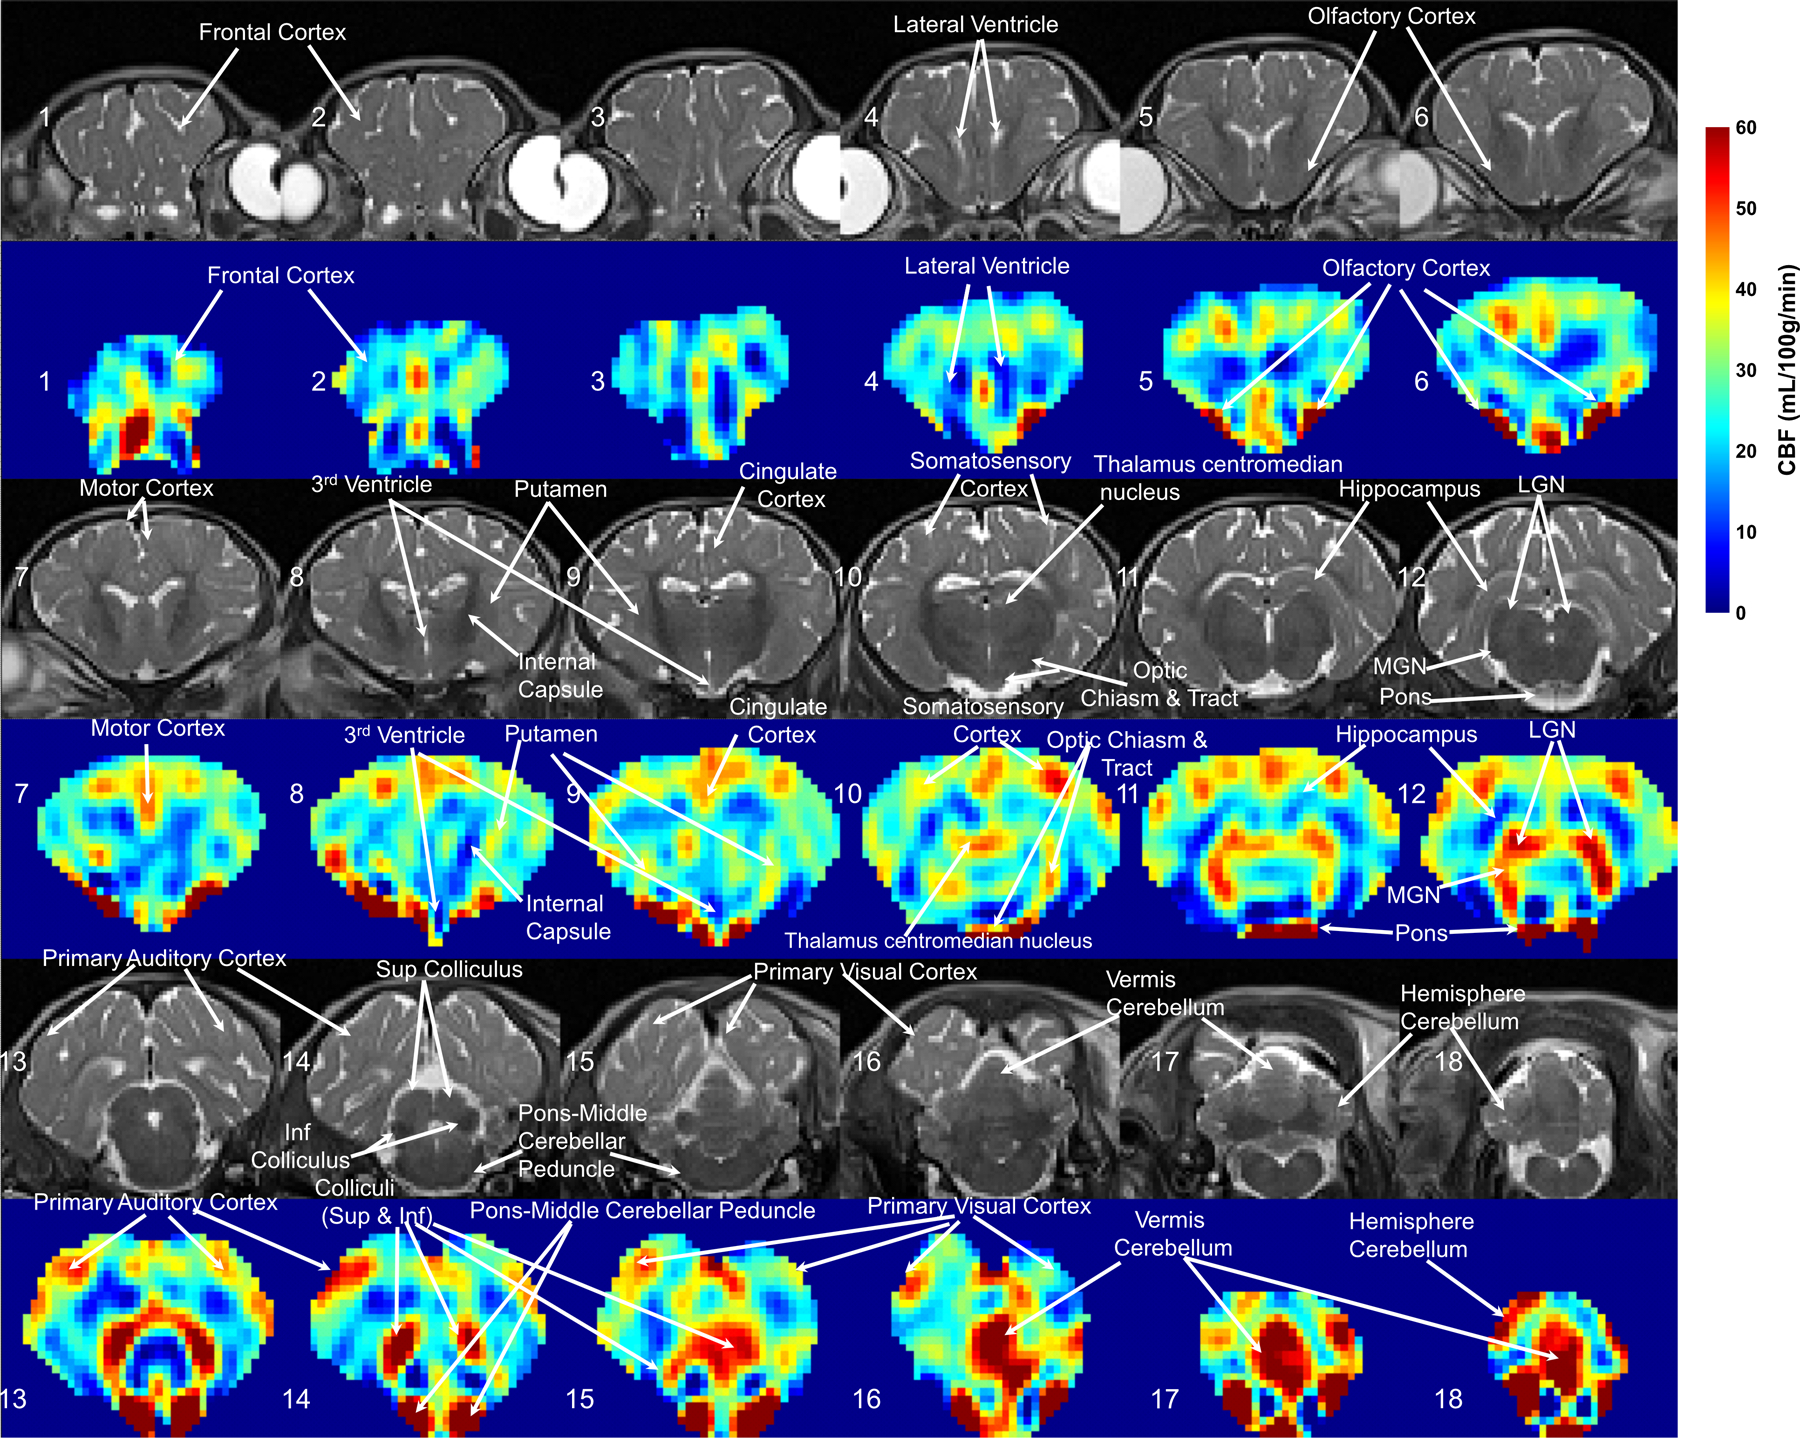
Figure 1:

Representative cerebral blood flow (CBF) maps derived from VSASL with 3D acquisition and whole–brain coverage from an anesthetized neonatal piglet after a sham procedure. The co-registered T2-weighted structural images are placed above the corresponding CBF maps. Coronal images are displayed and slice numbers are labeled from anterior (#1, top left) to posterior (#18, bottom right). Various brain structures and anatomical landmarks are annotated. Higher CBF values (see scale at right), indicating the areas where the metabolic activities are most active at this stage of postnatal development, were observed in the olfactory cortex (#5,6), somatosensory cortex (#10), motor cortex (#7), cingulate cortex (#9), dorsal thalamus (#12), including the lateral geniculate nucleus (LGN) and medial geniculate nucleus (MGN), brainstem (#14,15), including the tectum, and vermis cerebellum (#17).
