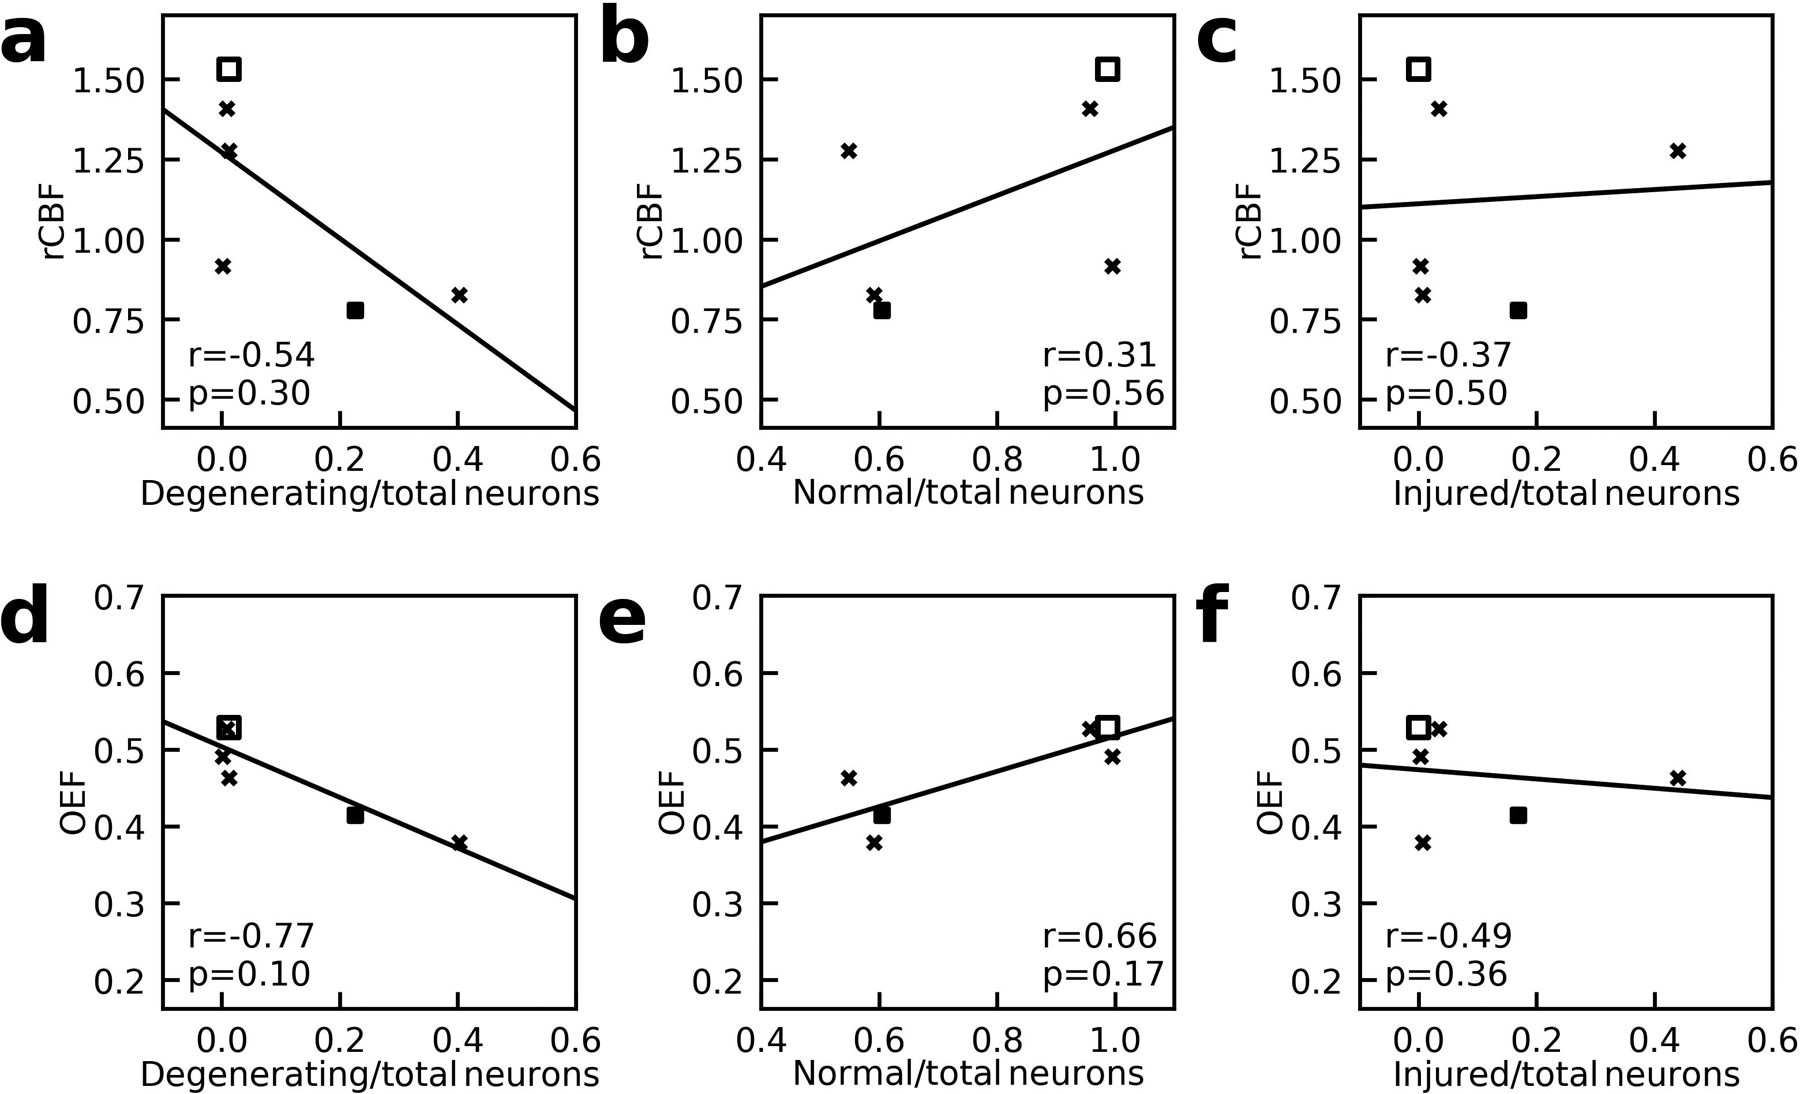
Figure 6:

Correlation between (a) the relative CBF (rCBF) of putamen and caudate of right side to the left side and the ratio of degenerating-to-total neurons; (b) rCBF and the ratio of normal-to-total neurons; (c) rCBF and the ratio of injured-to-total neurons; (d) oxygen-extraction-fraction (OEF) and the ratio of degenerating-to-total neurons; (e) OEF and the ratio of normal-to-total neurons; (f) OEF and the ratio of injured-to-total neurons. Here OEF values were obtained from the ICV. X-marks indicate piglets with quinolinic acid-induced brain injury. Solid squares indicate piglets with global hypoxic-ischemic brain injury. The open square represents a piglet that underwent the sham procedure. The lines of best-fit are also shown.
